USD/JPY is currently in a highly interesting technical and macro phase, characterized by divergences between price action and institutional positioning, negative seasonal signals, and retail sentiment that goes against what would typically be expected in a reversal scenario. Let’s break it down:
1. Institutional Positioning (COT Report)
The COT data reveals a mixed picture with bearish implications for USD/JPY:
On the USD side, non-commercial traders continue to increase their net long exposure (+2,044 new long contracts this week). However, this rise is almost equally offset by +1,975 new shorts, indicating indecision and hedging activity.
For the Japanese Yen, non-commercials (speculators) are significantly rebuilding long JPY positions, while commercials have started covering their short exposure.
📌 Implication: The net flow favors the Yen, meaning bearish pressure on USD/JPY. The increase in JPY long positions reflects expectations of a stronger Yen in the short to medium term.
2. Historical Seasonality
Seasonal data reinforces the bearish bias:
In May and June, USD/JPY has historically posted negative returns.
The 5-year average shows -0.57 in May and -0.76 in June, with both the 2Y and 10Y averages confirming a similar downward seasonal pattern.
📌 Implication: The current seasonal window does not favor a USD rebound vs. the Yen. Historically, the likelihood of downside increases into early summer.
3. Retail Sentiment
Retail traders are heavily long, with 64% positioned long on USD/JPY versus 36% short.
📌 Implication: From a contrarian perspective, this is a bearish signal. Markets tend to move against retail positioning, adding further downside risk.
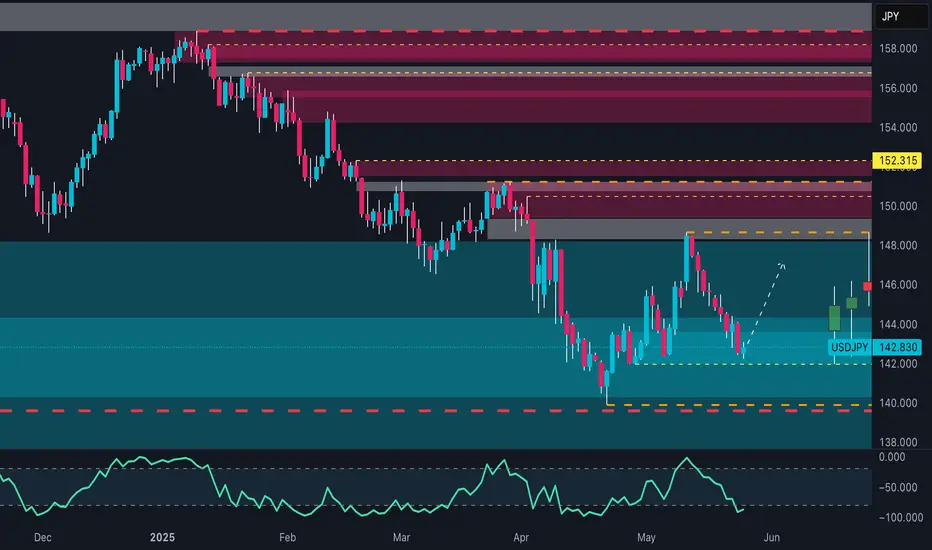
4. Price Action & Technical Structure (Daily Chart)
On the weekly chart:
Price broke the key 144.00 support decisively, closing the week at 142.81.
Structure shows lower highs and lower lows, typical of a bearish trend.
RSI is falling but still above oversold levels, leaving room for further downside.
First demand zone: 141.50–142.20. A confirmed break could open the way to 140.00–139.80.
Key resistance on any pullback: 145.00–146.00.
📌 Implication: The confirmed break of support activated a bearish continuation setup, unless short-term bounces offer new sell opportunities near resistance.
5. Market Depth
Market depth shows a strong cluster of long orders above current levels, while short volumes appear fragmented. This suggests any short-term rally could face aggressive selling between 144.50–145.50.
🎯 Conclusion & Operational Outlook
The overall context points to a high probability of further downside in USD/JPY over the short to medium term:
Smart money is rotating toward the Yen.
Seasonal patterns historically support a drop in May–June.
Contrarian retail sentiment adds additional bearish weight.
The weekly chart confirms a break of structure, opening space below 141.50.
1. Institutional Positioning (COT Report)
The COT data reveals a mixed picture with bearish implications for USD/JPY:
On the USD side, non-commercial traders continue to increase their net long exposure (+2,044 new long contracts this week). However, this rise is almost equally offset by +1,975 new shorts, indicating indecision and hedging activity.
For the Japanese Yen, non-commercials (speculators) are significantly rebuilding long JPY positions, while commercials have started covering their short exposure.
📌 Implication: The net flow favors the Yen, meaning bearish pressure on USD/JPY. The increase in JPY long positions reflects expectations of a stronger Yen in the short to medium term.
2. Historical Seasonality
Seasonal data reinforces the bearish bias:
In May and June, USD/JPY has historically posted negative returns.
The 5-year average shows -0.57 in May and -0.76 in June, with both the 2Y and 10Y averages confirming a similar downward seasonal pattern.
📌 Implication: The current seasonal window does not favor a USD rebound vs. the Yen. Historically, the likelihood of downside increases into early summer.
3. Retail Sentiment
Retail traders are heavily long, with 64% positioned long on USD/JPY versus 36% short.
📌 Implication: From a contrarian perspective, this is a bearish signal. Markets tend to move against retail positioning, adding further downside risk.
4. Price Action & Technical Structure (Daily Chart)
On the weekly chart:
Price broke the key 144.00 support decisively, closing the week at 142.81.
Structure shows lower highs and lower lows, typical of a bearish trend.
RSI is falling but still above oversold levels, leaving room for further downside.
First demand zone: 141.50–142.20. A confirmed break could open the way to 140.00–139.80.
Key resistance on any pullback: 145.00–146.00.
📌 Implication: The confirmed break of support activated a bearish continuation setup, unless short-term bounces offer new sell opportunities near resistance.
5. Market Depth
Market depth shows a strong cluster of long orders above current levels, while short volumes appear fragmented. This suggests any short-term rally could face aggressive selling between 144.50–145.50.
🎯 Conclusion & Operational Outlook
The overall context points to a high probability of further downside in USD/JPY over the short to medium term:
Smart money is rotating toward the Yen.
Seasonal patterns historically support a drop in May–June.
Contrarian retail sentiment adds additional bearish weight.
The weekly chart confirms a break of structure, opening space below 141.50.
📈 Nicola | EdgeTradingJourney
Documenting my path to $1M in prop capital through real trading, discipline, and analysis.
Documenting my path to $1M in prop capital through real trading, discipline, and analysis.
Disclaimer
The information and publications are not meant to be, and do not constitute, financial, investment, trading, or other types of advice or recommendations supplied or endorsed by TradingView. Read more in the Terms of Use.