Pattern Recognition is a trader/investor asset to identify possibles trades setups.
The markets demonstrate repetitive patterns where prices oscillate between one set of price ratios to another making price projections possible.
Market trends can be defined by geometric relationships as they exhibit harmonic relationships between the price and time swings.
Many traders use "cycles" and "harmonic" relationships to project future swing price/times.
These Harmonic price movements produce symmetric rallies and declines to give traders an advantage to determine the key turning points.
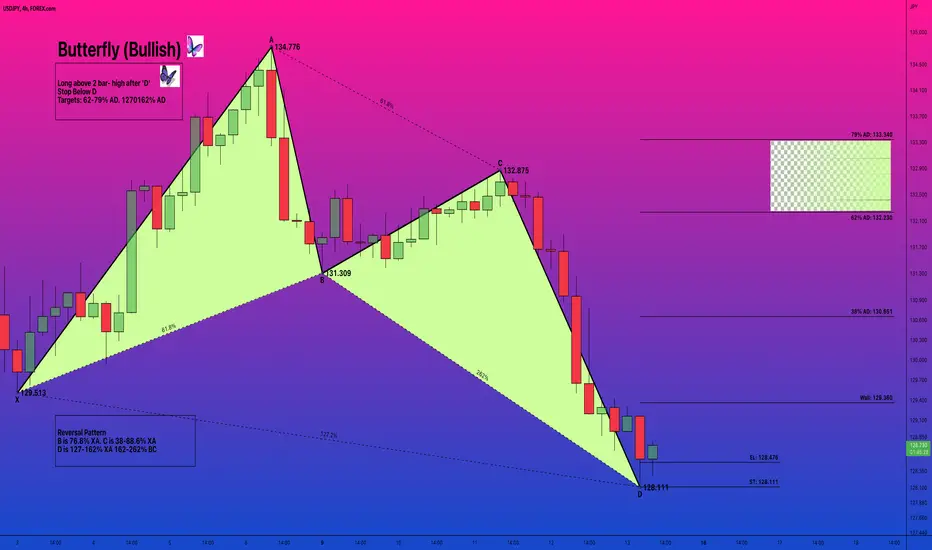
USD JPY Hourly chart We can identify a Pattern Structure ( Butterfly Bullish).
The concept of Harmonic Patterns was established by H.M. Gartley in 1932. Gartley wrote about a 5-point pattern (known as Gartley) in his book Profits in the Stock Market. Larry Pesavento has improved this pattern with Fibonacci ratios and established rules on how to trade the “Gartley” pattern in his book Fibonacci Ratios with Pattern Recognition.
There are few other authors who have worked on this pattern theory, but the best work to my knowledge is done by Scott Carney in his books of “Harmonic Trading.” Scott Carney also invented patterns like “Crab,” “Bat,” “Shark” and “5-0” and added real depth of knowledge for their trading rules, validity and risk/money management.
USDJPY Bullish Butterfly
EL: 128.476
ST: 128.111
Wall: 129.360
38% AD: 130.651
Target:
62% AD: 132.230
79% AD: 133.340
BUY above EL: 128.476 following up with a MSL (Market Structure Low) or 2-3 lines breaks
Pattern Invalidation 128.111
The markets demonstrate repetitive patterns where prices oscillate between one set of price ratios to another making price projections possible.
Market trends can be defined by geometric relationships as they exhibit harmonic relationships between the price and time swings.
Many traders use "cycles" and "harmonic" relationships to project future swing price/times.
These Harmonic price movements produce symmetric rallies and declines to give traders an advantage to determine the key turning points.
USD JPY Hourly chart We can identify a Pattern Structure ( Butterfly Bullish).
The concept of Harmonic Patterns was established by H.M. Gartley in 1932. Gartley wrote about a 5-point pattern (known as Gartley) in his book Profits in the Stock Market. Larry Pesavento has improved this pattern with Fibonacci ratios and established rules on how to trade the “Gartley” pattern in his book Fibonacci Ratios with Pattern Recognition.
There are few other authors who have worked on this pattern theory, but the best work to my knowledge is done by Scott Carney in his books of “Harmonic Trading.” Scott Carney also invented patterns like “Crab,” “Bat,” “Shark” and “5-0” and added real depth of knowledge for their trading rules, validity and risk/money management.
USDJPY Bullish Butterfly
EL: 128.476
ST: 128.111
Wall: 129.360
38% AD: 130.651
Target:
62% AD: 132.230
79% AD: 133.340
BUY above EL: 128.476 following up with a MSL (Market Structure Low) or 2-3 lines breaks
Pattern Invalidation 128.111
Note
Note
Worth to Keep an eye in this setupNote
The setup slightly change:ST: 127.553
EL: 127.825
38% AD: 130.307
62% AD: 132.008
79% AD: 133.237
Note
Hi buddies i restify this is not a Butterfly but a crab Note
H1 Chart:Note
USDJPY is trading above the EL: 128.049ST: 126.600
Targets:
38% AD: 130.307
62% AD: 132.008
79% AD: 133.237
Note
USDJPY target 38% AD: 130.307 and near the 62% AD: 132.008USDJPY could be forming an ABC and eventually Target the 62%
Note
Note
USDJPY has formed an ABC bullish trading near the entry level Note
Note
The Price has a bullish tendency to target:62% AD: 132.008
Note
Note
Note
The Price is trading the 1st target at the 62% 132.008Disclaimer
The information and publications are not meant to be, and do not constitute, financial, investment, trading, or other types of advice or recommendations supplied or endorsed by TradingView. Read more in the Terms of Use.
Disclaimer
The information and publications are not meant to be, and do not constitute, financial, investment, trading, or other types of advice or recommendations supplied or endorsed by TradingView. Read more in the Terms of Use.