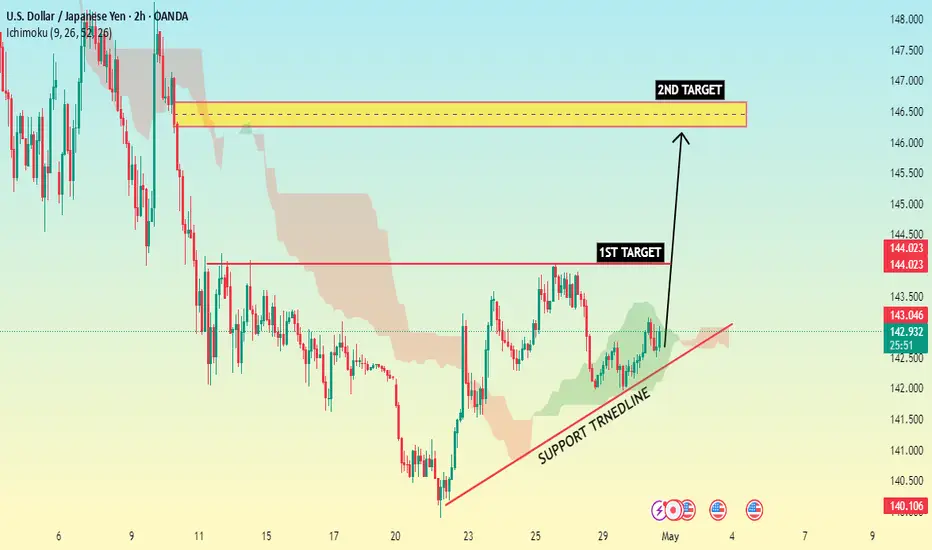
This is a 2-hour chart of USD/JPY showing a bullish setup. The price is currently respecting an ascending support trend line, indicating potential upward momentum. There are two marked resistance levels: the first target around 144. and the second target near the 146.00–146.50 zone. The chart suggests a bullish continuation if the price breaks above the first target zone, with the second target acting as a stronger resistance area. Ichimoku cloud support below the price also reinforces the bullish bias.
Trade closed: target reached
congratulation all target achieved 📲 Join telegram channel free ..
t.me/docter_Pips_official05
Forex, Gold & Crypto Signals with detailed analysis & get consistent results..
t.me/docter_Pips_official05
Gold Signal's with proper TP & SL for high profit.
t.me/docter_Pips_official05
Forex, Gold & Crypto Signals with detailed analysis & get consistent results..
t.me/docter_Pips_official05
Gold Signal's with proper TP & SL for high profit.
Disclaimer
The information and publications are not meant to be, and do not constitute, financial, investment, trading, or other types of advice or recommendations supplied or endorsed by TradingView. Read more in the Terms of Use.
📲 Join telegram channel free ..
t.me/docter_Pips_official05
Forex, Gold & Crypto Signals with detailed analysis & get consistent results..
t.me/docter_Pips_official05
Gold Signal's with proper TP & SL for high profit.
t.me/docter_Pips_official05
Forex, Gold & Crypto Signals with detailed analysis & get consistent results..
t.me/docter_Pips_official05
Gold Signal's with proper TP & SL for high profit.
Disclaimer
The information and publications are not meant to be, and do not constitute, financial, investment, trading, or other types of advice or recommendations supplied or endorsed by TradingView. Read more in the Terms of Use.