Hello traders,
Just sharing my idea of what might happen next based on the recent price movement.
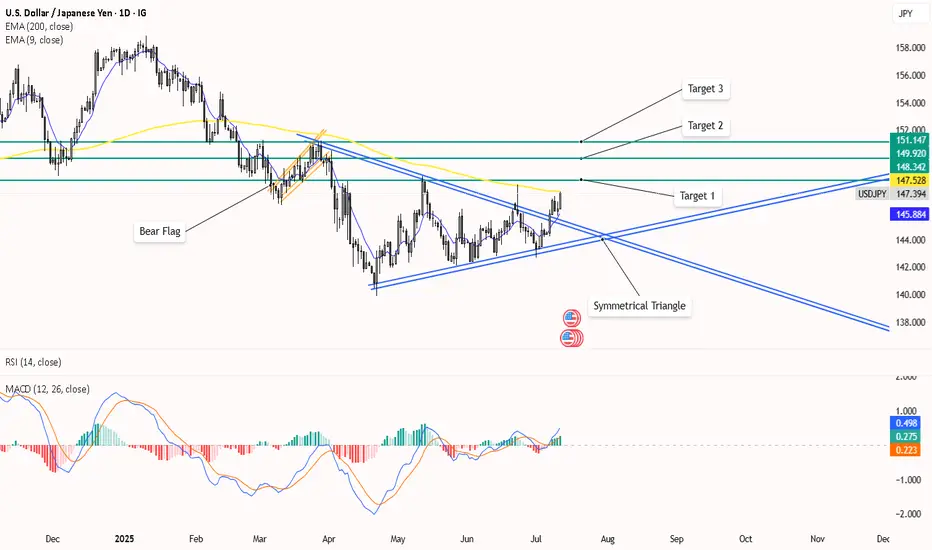
After a long downtrend this pair started gaining strength after April 2025 and formed a symmetrical triangle.
We can clearly see the breakout on 9 July 2025.
Will this breakout continue ?
Well, its about to touch the 200 Ema only than we can confirm if the bullish momentum keep continue. Price might pullback.
This analysis is based on chart patterns and some indicators like EMA, RSI, MACD and Fibonacci.
Just sharing my idea of what might happen next based on the recent price movement.
After a long downtrend this pair started gaining strength after April 2025 and formed a symmetrical triangle.
We can clearly see the breakout on 9 July 2025.
Will this breakout continue ?
Well, its about to touch the 200 Ema only than we can confirm if the bullish momentum keep continue. Price might pullback.
This analysis is based on chart patterns and some indicators like EMA, RSI, MACD and Fibonacci.
Disclaimer
The information and publications are not meant to be, and do not constitute, financial, investment, trading, or other types of advice or recommendations supplied or endorsed by TradingView. Read more in the Terms of Use.
Disclaimer
The information and publications are not meant to be, and do not constitute, financial, investment, trading, or other types of advice or recommendations supplied or endorsed by TradingView. Read more in the Terms of Use.