Triangle at USDJPY
In early November, the USDJPY formed a bottom and this was the beginning of a sideways movement.
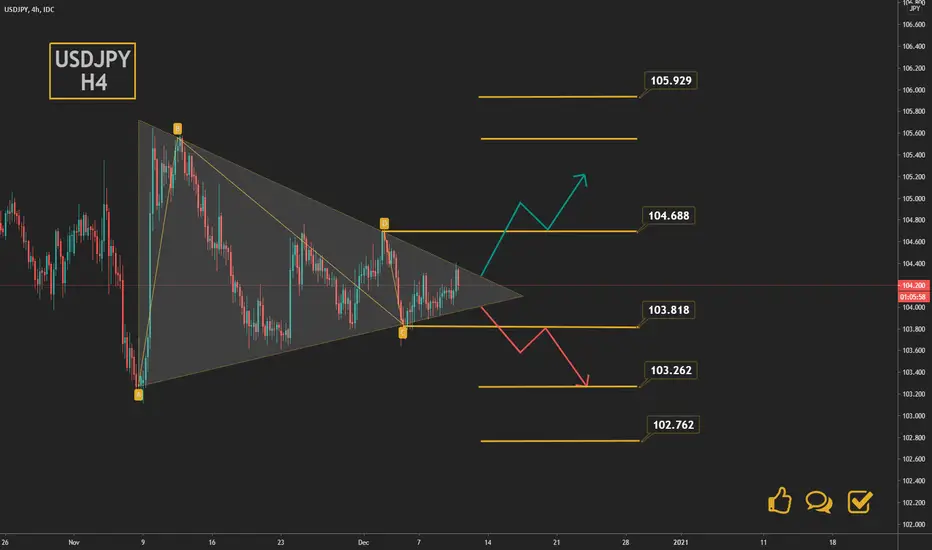
We see lower peaks and higher bottoms known as the Triangle figure.
The movemen has already closed and we expect a break.
The usual way is to trade the triangle break. But in order to avoid false break, it is safer if we enter into a trade only after breaking a previous peak or bottom.
For buy trades, this means breaking 104.68
For sell this means to break 103.82
Break means closing below / above the level!
This will give a clearer direction to what levels we can expect USDJPY to reach.
If you have questions about how to trade this or another situation, contact us!
To support us, like and comment! comments!
In early November, the USDJPY formed a bottom and this was the beginning of a sideways movement.
We see lower peaks and higher bottoms known as the Triangle figure.
The movemen has already closed and we expect a break.
The usual way is to trade the triangle break. But in order to avoid false break, it is safer if we enter into a trade only after breaking a previous peak or bottom.
For buy trades, this means breaking 104.68
For sell this means to break 103.82
Break means closing below / above the level!
This will give a clearer direction to what levels we can expect USDJPY to reach.
If you have questions about how to trade this or another situation, contact us!
To support us, like and comment! comments!
✅ JOIN FREE TELEGRAM: t.me/trendlinefreetrade
❓ If you got questions: t.me/Semkov
💡 If you want to know on what basis we make our entries, get in here: t.me/trendlinefreetrade
❓ If you got questions: t.me/Semkov
💡 If you want to know on what basis we make our entries, get in here: t.me/trendlinefreetrade
Related publications
Disclaimer
The information and publications are not meant to be, and do not constitute, financial, investment, trading, or other types of advice or recommendations supplied or endorsed by TradingView. Read more in the Terms of Use.