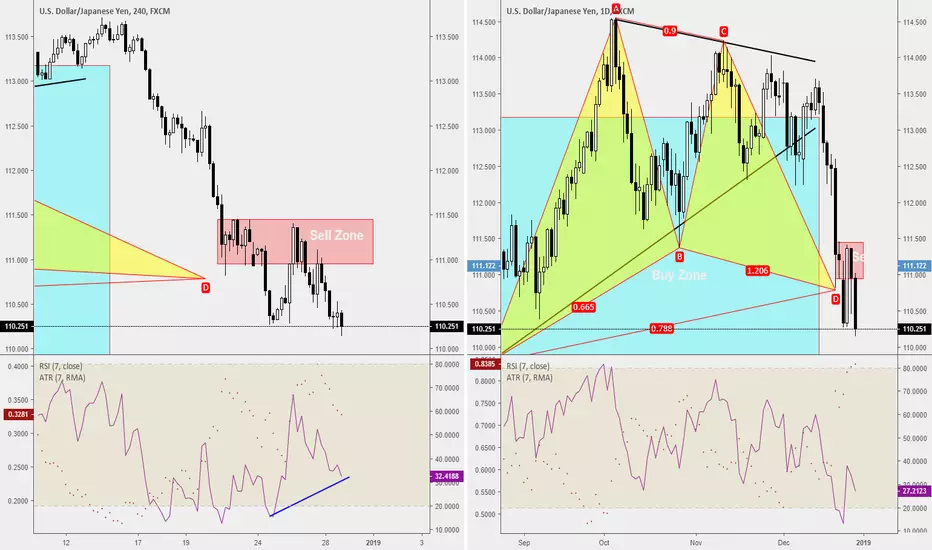
On the Daily Chart(right), the market has fallen straight into the buy zone and beyond the D completion but within X, that will give a better Reward:Risk.
However, on the left(4-hourly chart), the market has formed a new sell zone and that can be a warning signal for bullish traders to look out for. Perhaps a consideration of shifting stops to entry might be a great idea if an indecision candle has appeared within the sell zone.
If you do not wish to miss any more trade ideas, just subscribe to us and please do check out Oct 2018 results that it has given a total of 2,333pips of net profit in a single month.
http://forex100academy.com/tradeideas-oct2018/
🕒 15mins workday for Young Parents
🏦 Qualify Junior Analyst within 90days
🎤 Keynote Speaker
Get into our 15mins workday community
discord.gg/AKDr9vPqH7
Live session & Trading Tips on the GO
instagram.com/raynlim/
🏦 Qualify Junior Analyst within 90days
🎤 Keynote Speaker
Get into our 15mins workday community
discord.gg/AKDr9vPqH7
Live session & Trading Tips on the GO
instagram.com/raynlim/
Disclaimer
The information and publications are not meant to be, and do not constitute, financial, investment, trading, or other types of advice or recommendations supplied or endorsed by TradingView. Read more in the Terms of Use.