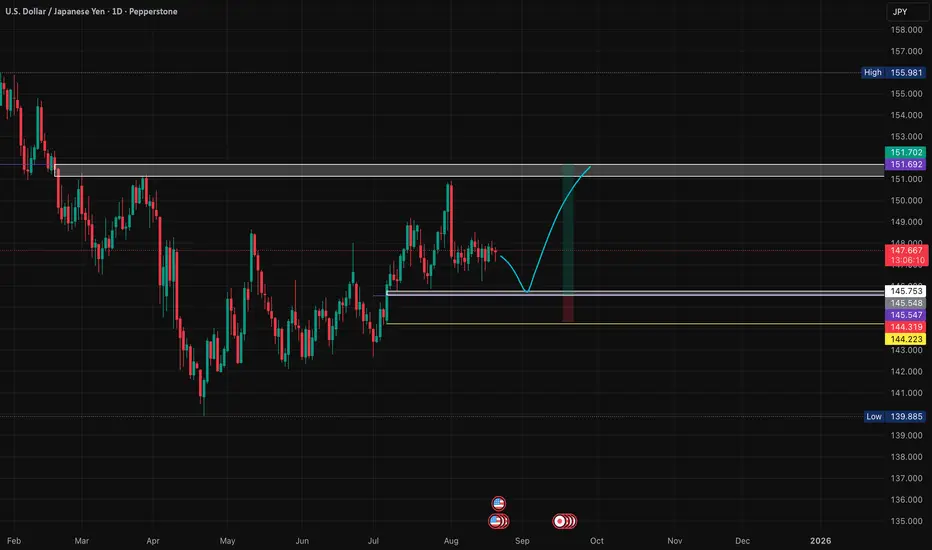
Sharing my longer-term perspective on USDJPY with a two-phase liquidity scenario. 📊
**🎯 The Big Picture:**
I'm expecting a classic two-phase move: first a liquidity hunt down to the lower purple line (white-boxed zone), followed by a strong rally up to the upper purple line. This would represent my ideal scenario for the coming months. 📈
**📍 Liquidity Zones Explained:**
The purple lines (highlighted in white boxes) represent key liquidity zones where stops are likely parked. Markets love to sweep these levels before making their real moves - it's textbook institutional behavior. 💰
**⏰ Timing Expectations:**
I expect the downside liquidity hunt to occur within the remaining days of this month or early next month. These moves often happen faster than people anticipate. ⚡
**🛡️ Invalidation Level:**
The yellow line marks the low of a strong weekly bullish candle - a significant structural point. If price breaks below this level, it would invalidate this bullish scenario entirely. 🚨
**🧠 Why This Setup Makes Sense:**
This type of liquidity grab followed by reversal is classic market mechanics. The lower liquidity zone represents trapped shorts and protective stops - perfect fuel for the eventual rally to the upper target. 🔄
**⚠️ Risk Management:**
Clear invalidation point below the yellow line, targeting the upper liquidity zone for a clean setup with defined parameters. 🎯
📈 **This trade setup offers a risk-to-reward ratio of 5:1.** Without including fees, the breakeven win rate for this trade would be approximately 16.67%. Knowing these figures in advance helps me avoid emotional trading. 🧠
💡 **Pro Tip**: If you often find yourself trading based on emotions, I recommend doing this type of pre-planning and quantifying your setups before execution — it can be a simple yet highly effective improvement. ✅
---
**Trading is simple.** You don't need multiple indicators or dozens of lines on your chart. A clean and simple chart often works best — it keeps your decisions consistent and reduces uncertainty. Sure, it might not look flashy, and my analysis may seem a bit "plain" compared to others… but that's how I like it. If you find this analysis useful, feel free to follow me for more updates.
---
*Disclaimer: This post is for general informational and educational purposes only. It does not constitute financial advice, investment recommendation, or a service targeting specific investors, and should not be considered illegal or restricted information in any jurisdiction.*
Disclaimer
The information and publications are not meant to be, and do not constitute, financial, investment, trading, or other types of advice or recommendations supplied or endorsed by TradingView. Read more in the Terms of Use.
Disclaimer
The information and publications are not meant to be, and do not constitute, financial, investment, trading, or other types of advice or recommendations supplied or endorsed by TradingView. Read more in the Terms of Use.
