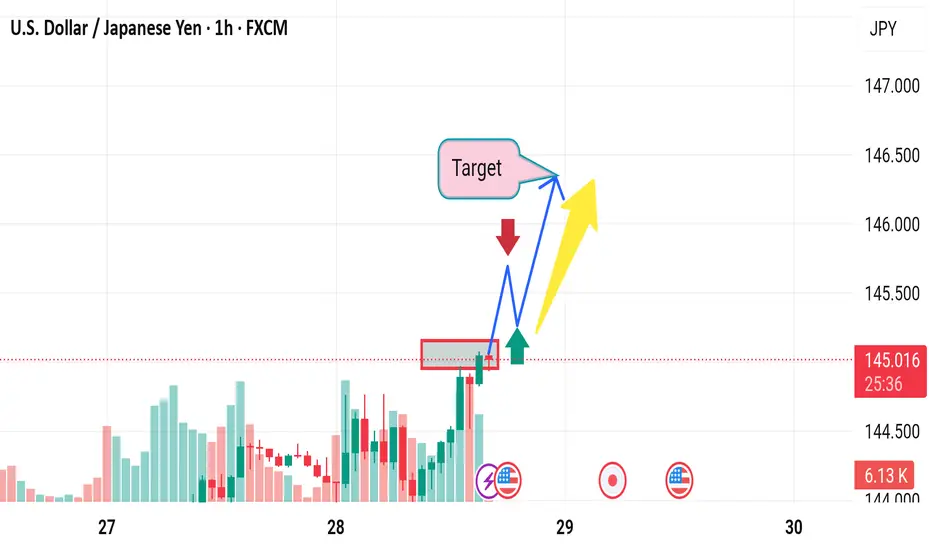
📊 Current Analysis Summary:
Pair: USD/JPY on the 1-hour timeframe.
Bias: Bullish breakout above a minor consolidation (highlighted box).
Target: Set higher, implying continuation of upward momentum.
Arrows: Show bullish path with a minor pullback, then a breakout continuation.
---
❌ Disruptive Breakdown:
🔴 1. Fake Breakout Risk
Price is testing the upper bound of the consolidation box. If this breakout fails to hold, it could trap late buyers. A rejection back inside the box might trigger a bearish reversal—a textbook bull trap scenario.
🔴 2. Volume Divergence
Despite the green breakout candle, the volume spike is not aggressive enough. If volume fails to increase further, it may suggest exhaustion, not momentum. This divergence undermines the breakout’s credibility.
🔴 3. Fundamental Uncertainty
Several U.S.-related economic icons (e.g., high-impact news) are visible. A hawkish BoJ or weaker-than-expected U.S. data could sharply reverse USD strength, causing a retracement or dump back below 145.000.
🔴 4. Overextended Short-Term Move
The steep rise could signal near-term exhaustion. RSI or other momentum indicators (not shown here) likely suggest overbought conditions, increasing the probability of a cool-off retracement.
🔴 5. Liquidity Grab & Drop Setup
Price might poke just above the box (to trigger stop losses and attract breakout traders), then reverse aggressively downward—a liquidity sweep or stop-hunt move before the real direction emerges.
t.me/gold_free_signals1
𝙁𝙤𝙧𝙚𝙭 𝙩𝙧𝙖𝙙𝙞𝙣𝙜 𝙚𝙭𝙥𝙚𝙧𝙞𝙚𝙣𝙘𝙚 𝙩𝙚𝙖𝙢 ☺️ 𝙢𝙖𝙣𝙖𝙜𝙚 𝙮𝙤𝙪𝙧 𝙖𝙘𝙘𝙤𝙪𝙣𝙩 𝙢𝙖𝙠𝙞𝙣𝙜 𝙢𝙤𝙣𝙚𝙮 🤑💰
t.me/gold_free_signals1
𝙁𝙤𝙧𝙚𝙭 𝙩𝙧𝙖𝙙𝙞𝙣𝙜 𝙚𝙭𝙥𝙚𝙧𝙞𝙚𝙣𝙘𝙚 𝙩𝙚𝙖𝙢 ☺️ 𝙢𝙖𝙣𝙖𝙜𝙚 𝙮𝙤𝙪𝙧 𝙖𝙘𝙘𝙤𝙪𝙣𝙩 𝙢𝙖𝙠𝙞𝙣𝙜 𝙢𝙤𝙣𝙚𝙮 🤑💰
t.me/gold_free_signals1
Disclaimer
The information and publications are not meant to be, and do not constitute, financial, investment, trading, or other types of advice or recommendations supplied or endorsed by TradingView. Read more in the Terms of Use.
t.me/gold_free_signals1
𝙁𝙤𝙧𝙚𝙭 𝙩𝙧𝙖𝙙𝙞𝙣𝙜 𝙚𝙭𝙥𝙚𝙧𝙞𝙚𝙣𝙘𝙚 𝙩𝙚𝙖𝙢 ☺️ 𝙢𝙖𝙣𝙖𝙜𝙚 𝙮𝙤𝙪𝙧 𝙖𝙘𝙘𝙤𝙪𝙣𝙩 𝙢𝙖𝙠𝙞𝙣𝙜 𝙢𝙤𝙣𝙚𝙮 🤑💰
t.me/gold_free_signals1
𝙁𝙤𝙧𝙚𝙭 𝙩𝙧𝙖𝙙𝙞𝙣𝙜 𝙚𝙭𝙥𝙚𝙧𝙞𝙚𝙣𝙘𝙚 𝙩𝙚𝙖𝙢 ☺️ 𝙢𝙖𝙣𝙖𝙜𝙚 𝙮𝙤𝙪𝙧 𝙖𝙘𝙘𝙤𝙪𝙣𝙩 𝙢𝙖𝙠𝙞𝙣𝙜 𝙢𝙤𝙣𝙚𝙮 🤑💰
t.me/gold_free_signals1
Disclaimer
The information and publications are not meant to be, and do not constitute, financial, investment, trading, or other types of advice or recommendations supplied or endorsed by TradingView. Read more in the Terms of Use.