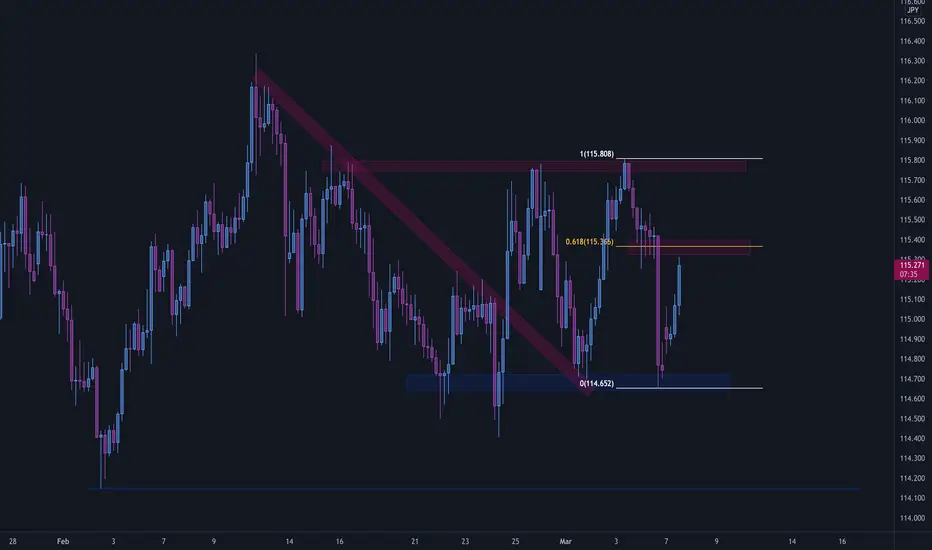
115.35 and 115.75 are zones to follow closely and look for SELL positions. The sentiment of USD/JPY is slowly shifting to bearish. 114.7 zone of support was a crucial area from where the price bounced off nicely. A massive bearish candle that was printed last week is another confirmation of the fact that bears are in control. At the moment, the price is approaching a key zone that lines up with 61.8% Fibonacci retracement level. We are gonna be closely monitoring the price action and seeing if the price manages to reject this zone of supply, so that we can go short and aim for the zone of support identified on the graph. If the price manages to continue rising and visit the level of 115.75, then we will be monitoring the price at that zone and waiting for a nice top to be formed before we go short and aim for the same zone of 114.15 support.
Disclaimer
The information and publications are not meant to be, and do not constitute, financial, investment, trading, or other types of advice or recommendations supplied or endorsed by TradingView. Read more in the Terms of Use.
Disclaimer
The information and publications are not meant to be, and do not constitute, financial, investment, trading, or other types of advice or recommendations supplied or endorsed by TradingView. Read more in the Terms of Use.