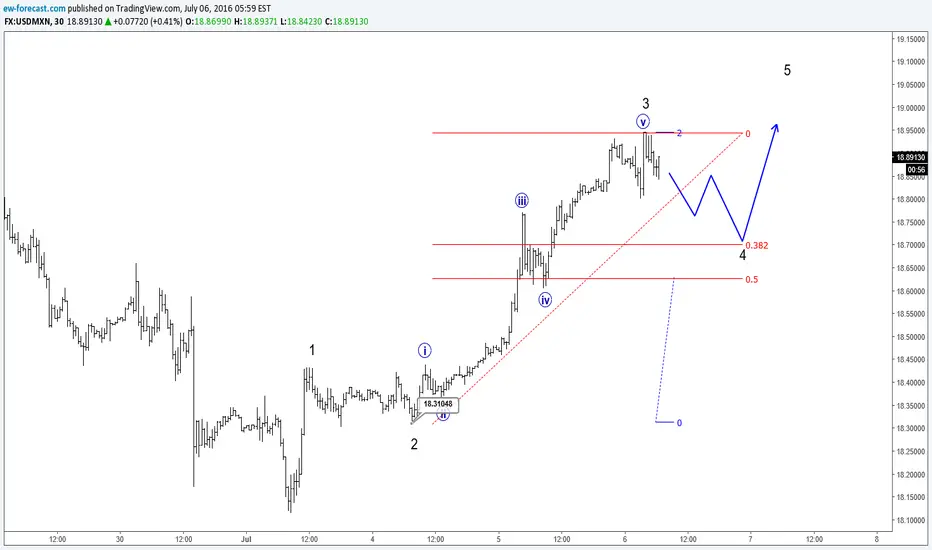
On the intraday chart of USDMXN, we are observing a nice bullish momentum taking place, that could face a correction soon, if the labeling is on track. We believe that this strong rally from 18.310 is wave 3, that could be completed as price touched the 2.0 Fibonacci ratio, which could suggest that a correction could be underway in wave 4. If price goes into a correction, then the next possible reversal higher for the wave 5 would be around the 0.5 and 0.382 Fibonacci ration, where these projections could act as supports higher.
ew-forecast.com
@ewforecast
ew-forecast.com
@ewforecast
👉Explore Our Services @ wavetraders.com/elliott-wave-plans/
Learn Elliott Waves
👉 wavetraders.com/academy/
Newsletter Sign up
👉 bit.ly/3FVPVzO
Learn Elliott Waves
👉 wavetraders.com/academy/
Newsletter Sign up
👉 bit.ly/3FVPVzO
Disclaimer
The information and publications are not meant to be, and do not constitute, financial, investment, trading, or other types of advice or recommendations supplied or endorsed by TradingView. Read more in the Terms of Use.