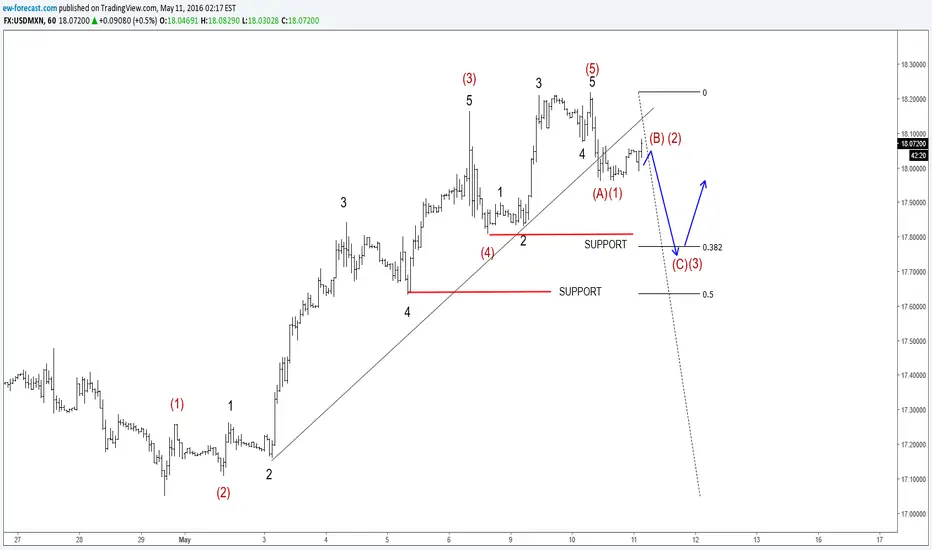
Intraday structure of USDMXN suggest that a temporary top can be in place around 18.218, as price made a nice five wave move to the upside, from recent lows at 17.053. Therefore as we know, after every five wave move a minimum three wave retracement usually follows, as in our case recent broken channel support line could indicate a temporary bearish run, with red wave (A) or (1) already completed. Ideally price will continue towards the level of a formal wave four, where some supports can be found before again turning to the upside.
ew-forecast.com
@ewforecast
ew-forecast.com
@ewforecast
US Single STOCKS (FREE Access), FX, Crypto
👉Explore Our Services @ wavetraders.com/elliott-wave-plans/
Learn Elliott Waves
👉 wavetraders.com/academy/
Newsletter Sign up
👉 bit.ly/3FVPVzO
👉Explore Our Services @ wavetraders.com/elliott-wave-plans/
Learn Elliott Waves
👉 wavetraders.com/academy/
Newsletter Sign up
👉 bit.ly/3FVPVzO
Disclaimer
The information and publications are not meant to be, and do not constitute, financial, investment, trading, or other types of advice or recommendations supplied or endorsed by TradingView. Read more in the Terms of Use.