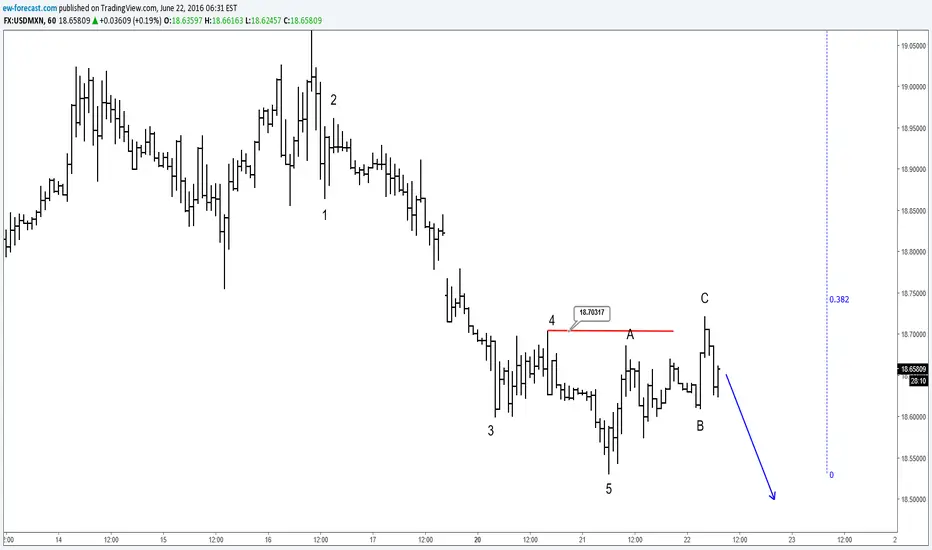
On the intraday chart of USDMXN, we are observing a nice impulsive 5 wave fall and its contra-trend movement labeled as A-B and C, that could already be completed, meaning that more weakness could follow. Looks like that formal wave 4 at 18.7031 and 38.2 Fibonacci ratio became a resistance zone and a possible new turning point lower.
ew-forecast.com
@ewforecast
ew-forecast.com
@ewforecast
US Single STOCKS (FREE Access), FX, Crypto
👉Explore Our Services @ wavetraders.com/elliott-wave-plans/
Learn Elliott Waves
👉 wavetraders.com/academy/
Newsletter Sign up
👉 bit.ly/3FVPVzO
👉Explore Our Services @ wavetraders.com/elliott-wave-plans/
Learn Elliott Waves
👉 wavetraders.com/academy/
Newsletter Sign up
👉 bit.ly/3FVPVzO
Disclaimer
The information and publications are not meant to be, and do not constitute, financial, investment, trading, or other types of advice or recommendations supplied or endorsed by TradingView. Read more in the Terms of Use.