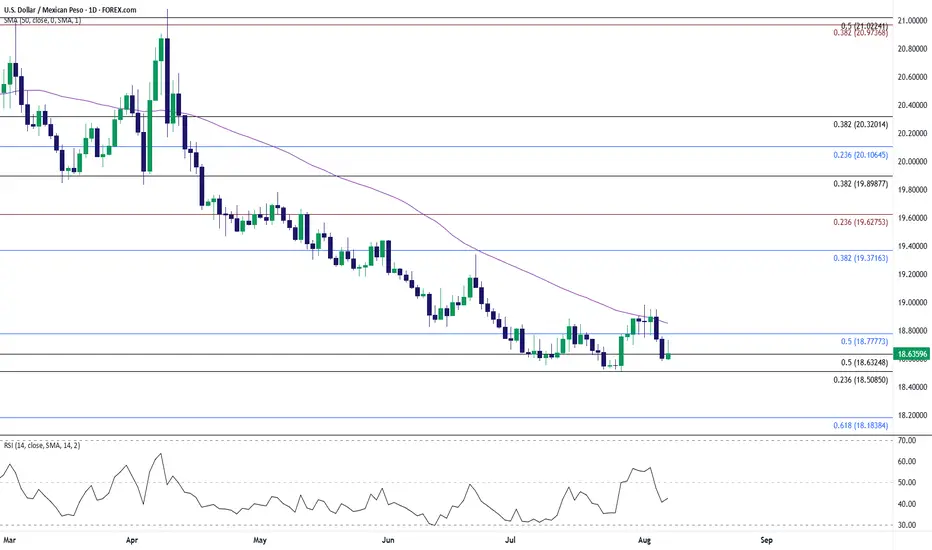
USD/MXN seems to be defending the rebound from the July low (18.5116) as it attempts to retrace the decline from earlier this week.
A breach above 18.7780 (50% Fibonacci retracement) may push USD/MXN toward the monthly high (18.9810), with a move/close above 19.3720 (38.2% Fibonacci retracement) opening up the June high (19.4441).
Next area of interest comes in around 19.6280 (23.6% Fibonacci extension), but USD/MXN may struggle to retain the rebound from the July low (18.5116) should it track the negative slope in the 50-Day SMA (18.8511).
A move/close below the 18.5090 (23.6% Fibonacci retracement) to 18.6330 (50% Fibonacci retracement) zone brings the August 2024 low (18.4291) on the radar, with the next area of interest coming in around 18.1840 (61.8% Fibonacci retracement).
--- Written by David Song, Senior Strategist at FOREX.com
Disclaimer
The information and publications are not meant to be, and do not constitute, financial, investment, trading, or other types of advice or recommendations supplied or endorsed by TradingView. Read more in the Terms of Use.
Disclaimer
The information and publications are not meant to be, and do not constitute, financial, investment, trading, or other types of advice or recommendations supplied or endorsed by TradingView. Read more in the Terms of Use.