Use this as an Idea to develop your own setup
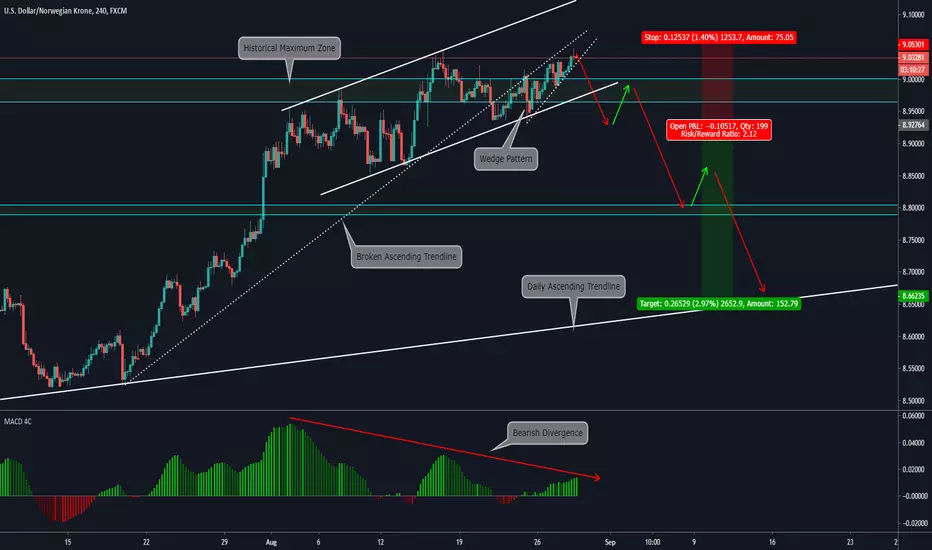
Main Items we see on the 4HS Chart:
a)Price is on Maximum Historical Highs, this is an important Resistance Zone (check Weekly chart)
b)MACD divergence, this is a clear signal of the weakness of the current bullish movement
c)The Main Ascending trendline is broken and the price is making a pullback over that trendline
d)Currently, we can see a Wedge pattern structure, this type of formations are reversal structures
e)On the chart we have set Entry/Stop/Take Profit, this configuration gives a really good Risk Reward Ratio, Higher than 2:1 with a really good Stop
Multy timeframe analysis
Weekly Chart:

Daily Chart:

Main Items we see on the 4HS Chart:
a)Price is on Maximum Historical Highs, this is an important Resistance Zone (check Weekly chart)
b)MACD divergence, this is a clear signal of the weakness of the current bullish movement
c)The Main Ascending trendline is broken and the price is making a pullback over that trendline
d)Currently, we can see a Wedge pattern structure, this type of formations are reversal structures
e)On the chart we have set Entry/Stop/Take Profit, this configuration gives a really good Risk Reward Ratio, Higher than 2:1 with a really good Stop
Multy timeframe analysis
Weekly Chart:
Daily Chart:
Disclaimer
The information and publications are not meant to be, and do not constitute, financial, investment, trading, or other types of advice or recommendations supplied or endorsed by TradingView. Read more in the Terms of Use.
Disclaimer
The information and publications are not meant to be, and do not constitute, financial, investment, trading, or other types of advice or recommendations supplied or endorsed by TradingView. Read more in the Terms of Use.