Monthly Chart:

Still in bullish forming trend.
Weekly Chart:

Looks like forming head and shoulder.
Need to be careful. As it hits around the previous resistance and drop.
Short term for weekly chart is consolidating or bearish.
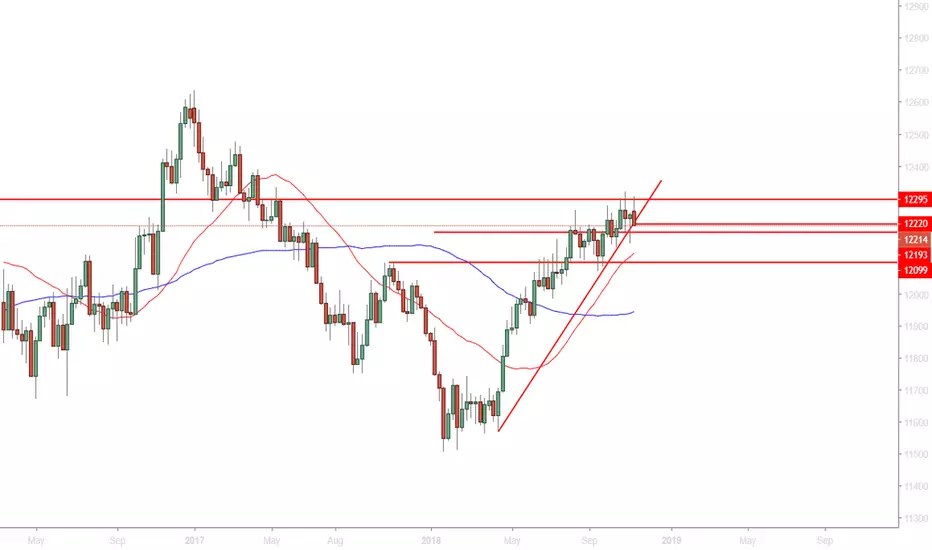
Daily Chart:

Daily chart is getting hit on the resistance.
The bullish is exhausted.
Short term consolidating between 12261 and 12071.
4-Hour Chart:

Trend line for short term broken.
Likely to be bearish for short term.
Lets observe and find a good point to buy and continue the bullish.
Patient is the key to success in trading.
Trade only what you know and not what you don't know.
Trade only regarding the timeline that you are familiar with.
Do not let your emotion or panic affect your trading plan and decision making.
Still in bullish forming trend.
Weekly Chart:
Looks like forming head and shoulder.
Need to be careful. As it hits around the previous resistance and drop.
Short term for weekly chart is consolidating or bearish.
Daily Chart:
Daily chart is getting hit on the resistance.
The bullish is exhausted.
Short term consolidating between 12261 and 12071.
4-Hour Chart:
Trend line for short term broken.
Likely to be bearish for short term.
Lets observe and find a good point to buy and continue the bullish.
Patient is the key to success in trading.
Trade only what you know and not what you don't know.
Trade only regarding the timeline that you are familiar with.
Do not let your emotion or panic affect your trading plan and decision making.
Disclaimer
The information and publications are not meant to be, and do not constitute, financial, investment, trading, or other types of advice or recommendations supplied or endorsed by TradingView. Read more in the Terms of Use.
Disclaimer
The information and publications are not meant to be, and do not constitute, financial, investment, trading, or other types of advice or recommendations supplied or endorsed by TradingView. Read more in the Terms of Use.