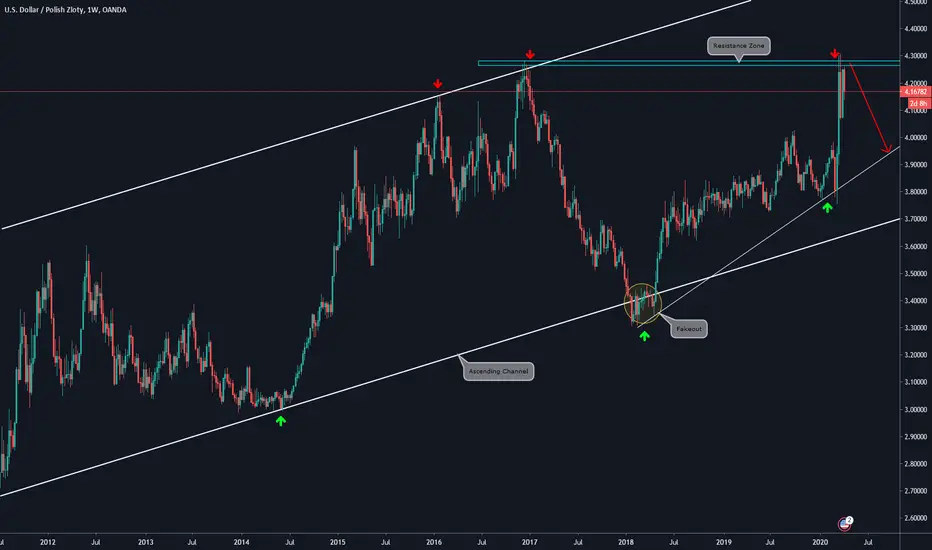
🔸 WEEKLY CHART EXPLANATION:
.
🔸 Price is on an uptrend, however it has formed a double top pattern with the previous max level.
.
🔸 We observe that the level could not be broken, and, if we go to a lower timeframe, we see some bearish signals.
.
🔸 It has potential to reach the Ascending Trendline.
.
🔸 Will look for a lower timeframe Bearish setup.
🔸DAILY CHART ANALYSIS:

.
🔸 Price is on an uptrend, however it has formed a double top pattern with the previous max level.
.
🔸 We observe that the level could not be broken, and, if we go to a lower timeframe, we see some bearish signals.
.
🔸 It has potential to reach the Ascending Trendline.
.
🔸 Will look for a lower timeframe Bearish setup.
🔸DAILY CHART ANALYSIS:
Disclaimer
The information and publications are not meant to be, and do not constitute, financial, investment, trading, or other types of advice or recommendations supplied or endorsed by TradingView. Read more in the Terms of Use.
Disclaimer
The information and publications are not meant to be, and do not constitute, financial, investment, trading, or other types of advice or recommendations supplied or endorsed by TradingView. Read more in the Terms of Use.