My previous idea https://tradingview.sweetlogin.com/chart/USDRUB/LabqUJ3p-USDRUB-Possible-wave-count-TARGET-41-75/ showed the strength of the RUB.
I watched it closely and the very tight range and a lot of see-saw moves on USDRUB daily chart changed my mind.
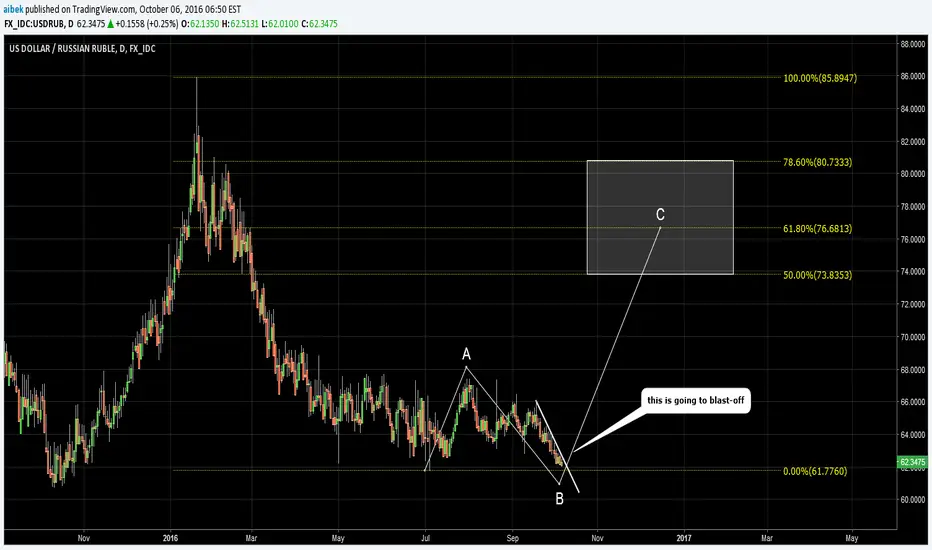
I think we are not going to go much lower. I would quit short and book profit.
Updated view shows the corrective structure upside with the large C pending.
Target for C highlighted in a white rectangle with range between 50 and 78.6% Fibonacci retracement.
I watched it closely and the very tight range and a lot of see-saw moves on USDRUB daily chart changed my mind.
I think we are not going to go much lower. I would quit short and book profit.
Updated view shows the corrective structure upside with the large C pending.
Target for C highlighted in a white rectangle with range between 50 and 78.6% Fibonacci retracement.
Note
Pls follow this idea at the link below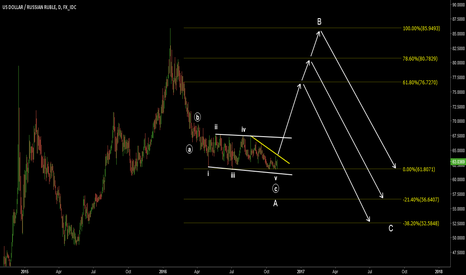
Related publications
Disclaimer
The information and publications are not meant to be, and do not constitute, financial, investment, trading, or other types of advice or recommendations supplied or endorsed by TradingView. Read more in the Terms of Use.
Related publications
Disclaimer
The information and publications are not meant to be, and do not constitute, financial, investment, trading, or other types of advice or recommendations supplied or endorsed by TradingView. Read more in the Terms of Use.