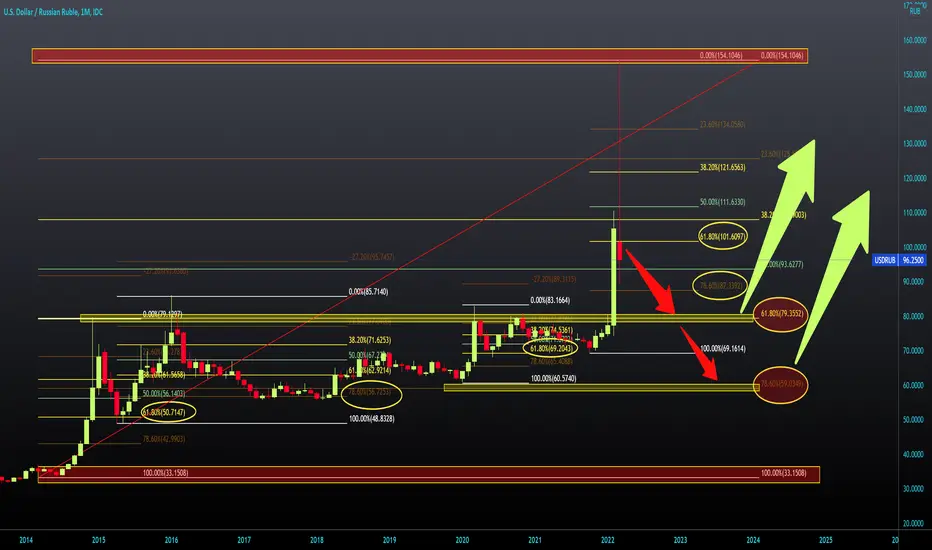
Since 2014, we have had four impulses that have led to the weakening of the Russian ruble.
Setting the Fibonacci level shows that the USDRUB pair makes a pullback to 61.8-78.6% of the Fibonacci level after the bullish pulse.
We had resistance around the 80,000 level in the previous eight years, which was broken in February this year.
The last bullish impulse was to reduce the value of the Russian ruble by 98% (154,100) on March 7 from the value from the beginning of the year 74,000.
The current pullback lowered the pair USDRUB to 97,500 in the zone between 61.8-78.6% Fibonacci levels.
We should now see consolidation in this zone or a new bullish impulse according to this pattern.
If we set up big Fibonacci with a minimum from 2014 and a maximum current in 2022, the potential support zone is between 60,000 and 80,000 levels.
Note
Disclaimer
The information and publications are not meant to be, and do not constitute, financial, investment, trading, or other types of advice or recommendations supplied or endorsed by TradingView. Read more in the Terms of Use.
Disclaimer
The information and publications are not meant to be, and do not constitute, financial, investment, trading, or other types of advice or recommendations supplied or endorsed by TradingView. Read more in the Terms of Use.