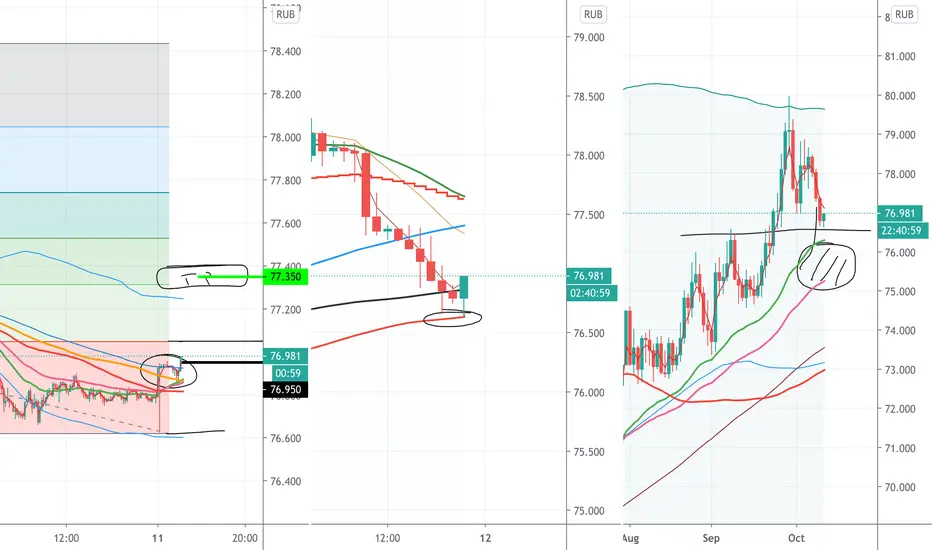
5 min chart :Breaking above bunch of ma on 5 min chart and break happened below fibo retracement 0.28
Good location for rebounding to at least previous fibo level or little higher.
4hr chart : steep decline. Two candles with same wicks .
Daily chart decline to previous spikes, and approaches strong support level between 76.15 and 75.00
I bought here at 76.95. I was looking at this to buy before weekend at 76.85 were it broke above bunch of ma on 2 min chart, but don’t want to hold it overweekend.
I dont have stop loss on this one because if it’s start dropping in to daily support i will accumulate more.
Disclaimer
The information and publications are not meant to be, and do not constitute, financial, investment, trading, or other types of advice or recommendations supplied or endorsed by TradingView. Read more in the Terms of Use.
Disclaimer
The information and publications are not meant to be, and do not constitute, financial, investment, trading, or other types of advice or recommendations supplied or endorsed by TradingView. Read more in the Terms of Use.