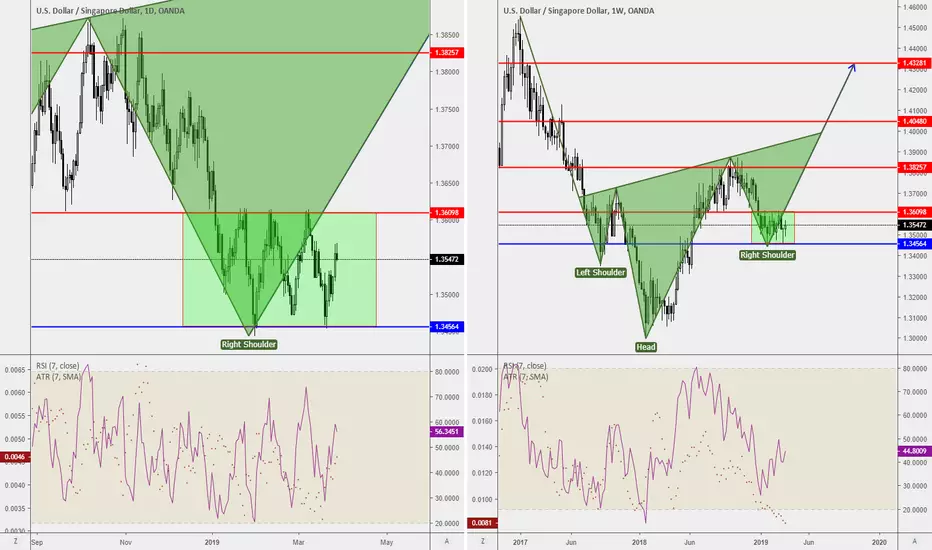
At this moment on USDSGD Daily Chart USDSGD is moving on a sideways market movement and it ranges between 1.3456-1.3609. USDSGD has been ranging for the past 3-months a break of the market movement is certain.
There are 2 possibilities of its movement, an appreciation of USDSGD is more likely the and continuation of a bearish move.
If the market break and close above 1.3609, is a likelihood for it to move towards 1.3825 and a break of that moving towards 1.4048 is seen.
The analysis is only for reference purposes and it shouldn't be used for any investment or trading purposes.
🕒 15mins workday for Young Parents
🏦 Qualify Junior Analyst within 90days
🎤 Keynote Speaker
Get into our 15mins workday community
discord.gg/AKDr9vPqH7
Live session & Trading Tips on the GO
instagram.com/raynlim/
🏦 Qualify Junior Analyst within 90days
🎤 Keynote Speaker
Get into our 15mins workday community
discord.gg/AKDr9vPqH7
Live session & Trading Tips on the GO
instagram.com/raynlim/
Disclaimer
The information and publications are not meant to be, and do not constitute, financial, investment, trading, or other types of advice or recommendations supplied or endorsed by TradingView. Read more in the Terms of Use.