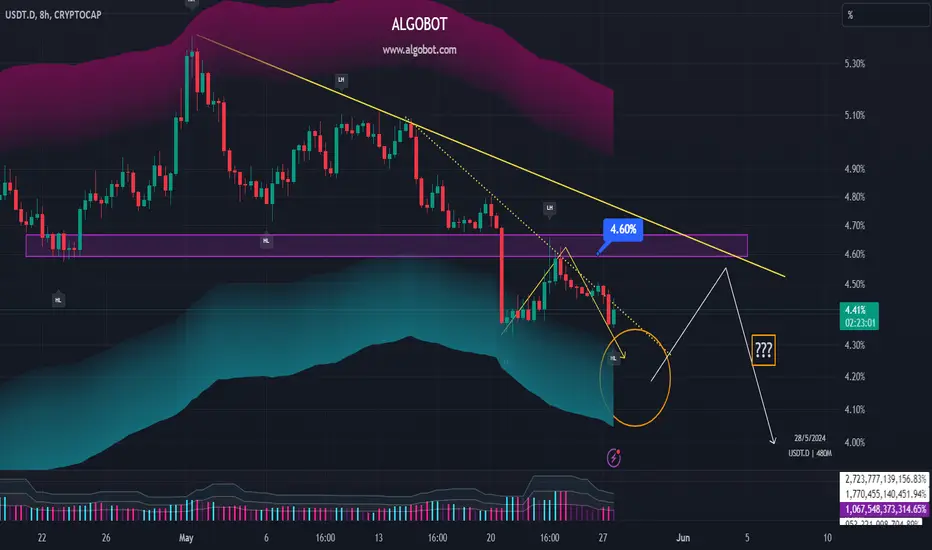
USDT Dominance chart has followed previous analysis (May 21) and there was a retest of 4.60% area as predicted.
New analysis suggests that there might be another retest of 4.5% - 4.6% zone in which the yellow trendline is touched again. if this scenario takes place, we will see another dump in the market.
New analysis suggests that there might be another retest of 4.5% - 4.6% zone in which the yellow trendline is touched again. if this scenario takes place, we will see another dump in the market.
Disclaimer
The information and publications are not meant to be, and do not constitute, financial, investment, trading, or other types of advice or recommendations supplied or endorsed by TradingView. Read more in the Terms of Use.
Disclaimer
The information and publications are not meant to be, and do not constitute, financial, investment, trading, or other types of advice or recommendations supplied or endorsed by TradingView. Read more in the Terms of Use.