The USDTRY pair starts looking tired. It does not seem to trend upwards.
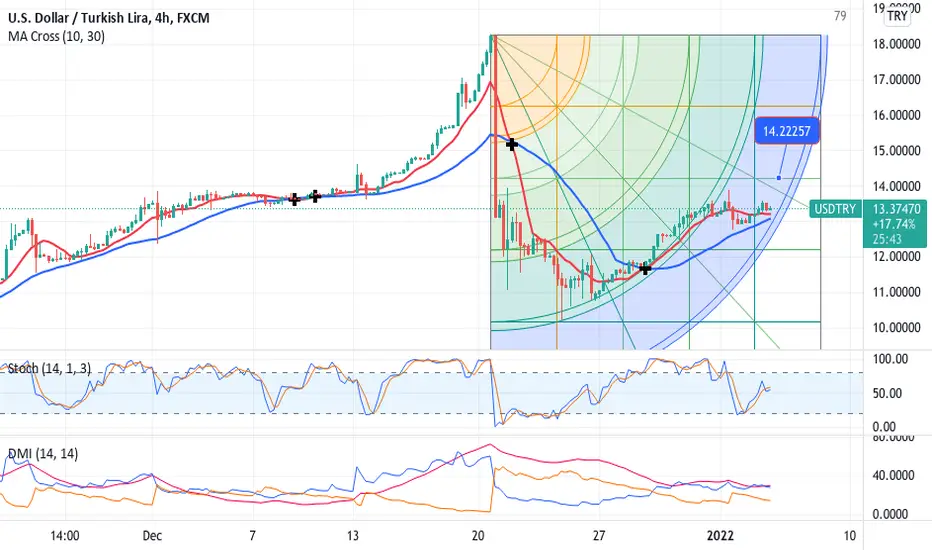
The 4-hourly chart starts looking negative, i.e. the 10-MA vs 30-MA turning and ikely may break. The stochastic is negative, and the DMI is flat and DMI+ below signal line. Further, providing we remain below 14.25, the chances are we move lower 10.50-10.75.
Today am preferred SELL at current 13.20-13.50 and place stop-loss at 14.35. If broker, re-sell 15.25-15.50.
Profit order 10.75 for now.
Note
My daily analysis limit is used up :) The LONG-TERM chart suggest SELL USDTRY 13.50-17.50 for a move to 9.46 FIB re-tracement value as a note.Note
I like to add we do have NEW MOON phase, which suggest downward move as well.Disclaimer
The information and publications are not meant to be, and do not constitute, financial, investment, trading, or other types of advice or recommendations supplied or endorsed by TradingView. Read more in the Terms of Use.
Disclaimer
The information and publications are not meant to be, and do not constitute, financial, investment, trading, or other types of advice or recommendations supplied or endorsed by TradingView. Read more in the Terms of Use.