No change in view.
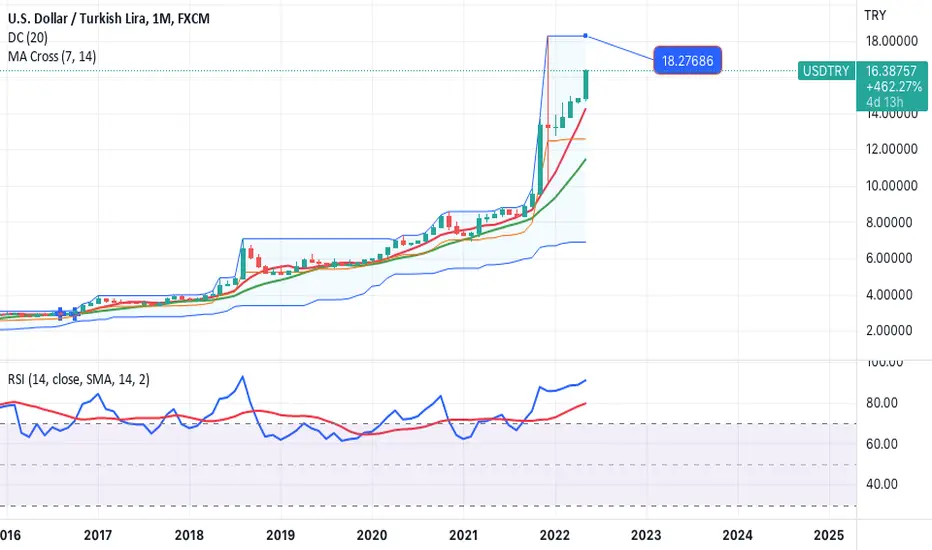
Also this chart is directed towards those that have keen interest in the pair for a long-term basis. To clarify, when we look at a month chart, it means that our objectives are for the coming 6-8 months, and sometimes shorter time-period.
The last time when we had a RSI of 85.00 on monthly chart, the higher of USDTRY was 18.27, and everyone was saying we will go 20.00 above. The chart already was over bought once crossing 80.0 RSI which started above 12.00-13.00. So the RSI increased from 80.0 to 85.0 and that is where we got an overnight drop to 10.50 below. From there it was anticipated we should see back up to 14.00, and we traded for a while around that level drifting very slow or not at all.
Last week we started seeing 16.00 handle and that is where we are now. To cut the long story, a long-term SHORT would be short since 13.50-14.50 and adding above 16.50 once again. After we add again 17.50-18.00.
It is still possible to see higher and re-test 18.27 and the RSI will likely be somewhere 92.0-93.00. Overall, whether RSI is 85.0 or 91.0 for a monthly chart it means we see a collapse to lower levels. This is for some difficult to believe, and well fundamentally they are right, but market is LONG and one day or week the correction will happen, same as it did last December 2021. People have forgotten that already. Good luck everyone.
Disclaimer
The information and publications are not meant to be, and do not constitute, financial, investment, trading, or other types of advice or recommendations supplied or endorsed by TradingView. Read more in the Terms of Use.
Disclaimer
The information and publications are not meant to be, and do not constitute, financial, investment, trading, or other types of advice or recommendations supplied or endorsed by TradingView. Read more in the Terms of Use.