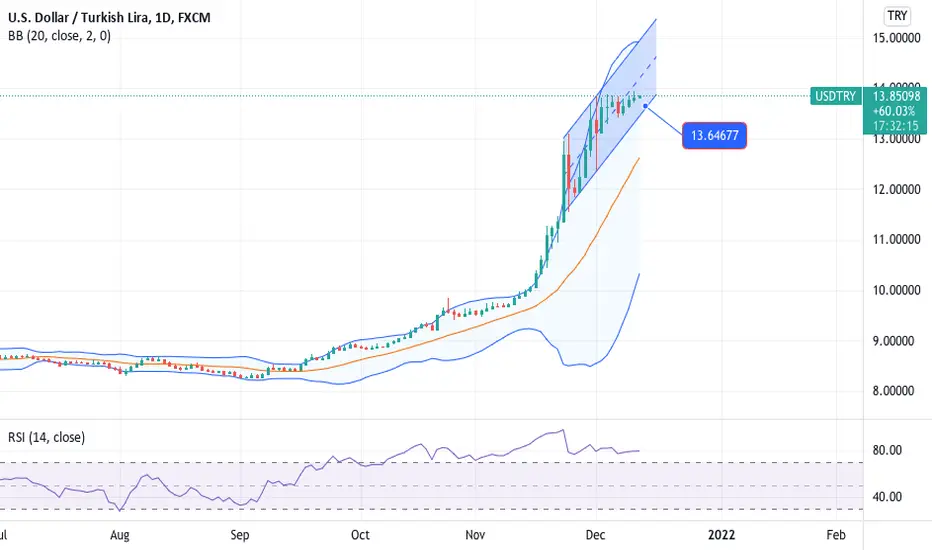
We are remaining on the high side, and the weekly chart currently has RSI 93.68, whilst the daily near 80.0.
The pattern on daily chart is a FALSE BULL FLAG which means we will see a move downward over time. The support is around 13.6400.
I remain having the view expecting a move towards 10.05-10.3500. It is even possible to see 8.7500 judging monthly chart condition.
The pattern on daily chart is a FALSE BULL FLAG which means we will see a move downward over time. The support is around 13.6400.
I remain having the view expecting a move towards 10.05-10.3500. It is even possible to see 8.7500 judging monthly chart condition.
Disclaimer
The information and publications are not meant to be, and do not constitute, financial, investment, trading, or other types of advice or recommendations supplied or endorsed by TradingView. Read more in the Terms of Use.
Disclaimer
The information and publications are not meant to be, and do not constitute, financial, investment, trading, or other types of advice or recommendations supplied or endorsed by TradingView. Read more in the Terms of Use.