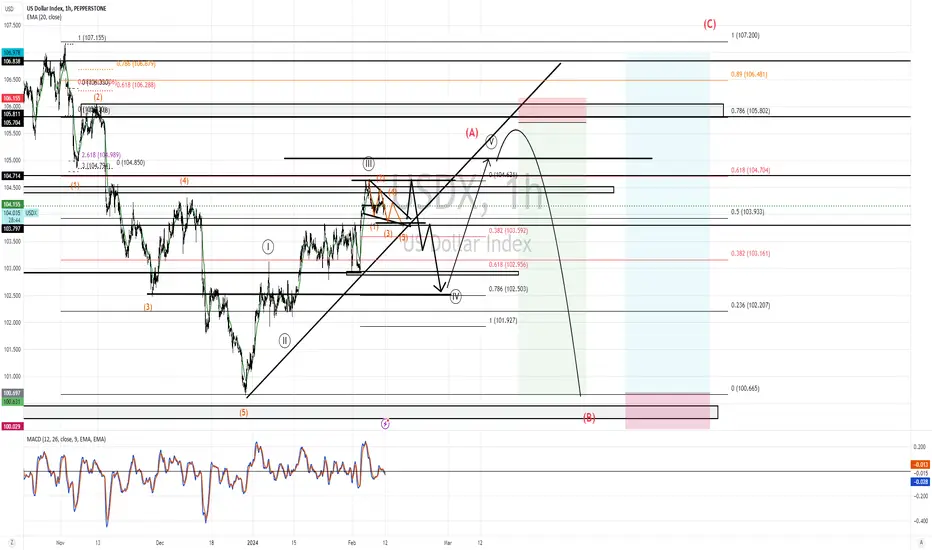
From the previous price and chart of pattern. About my understanding I think wave quite be like this and nowadays price pattern look like falling wedge.
So, maybe have a probability to rising first and cannot do higher high then sideway down
likes the path on the picture.
So, maybe have a probability to rising first and cannot do higher high then sideway down
likes the path on the picture.
Disclaimer
The information and publications are not meant to be, and do not constitute, financial, investment, trading, or other types of advice or recommendations supplied or endorsed by TradingView. Read more in the Terms of Use.
Disclaimer
The information and publications are not meant to be, and do not constitute, financial, investment, trading, or other types of advice or recommendations supplied or endorsed by TradingView. Read more in the Terms of Use.