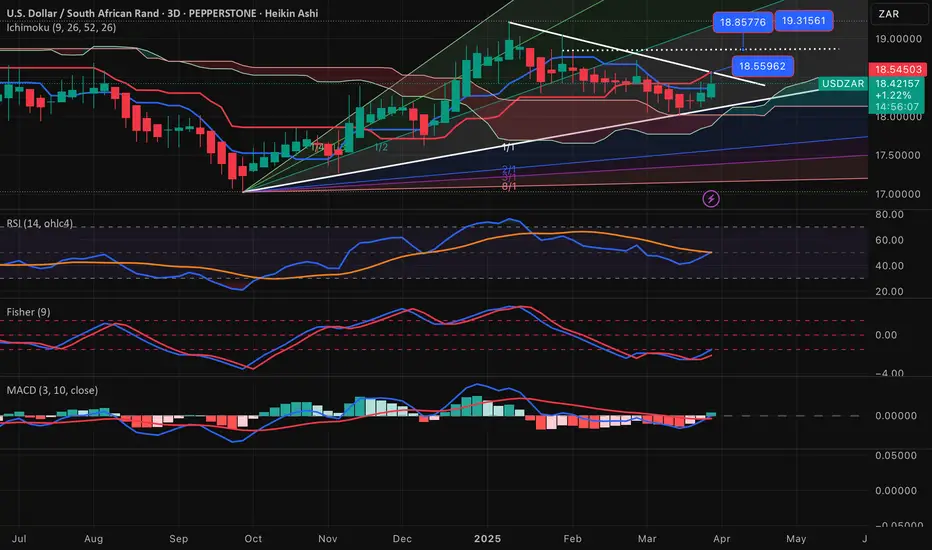
I am always interested looking at the other chart types, and time-frames. Short-term we may see some obstacles for the pair and corrective activity is possible. Also this chart based on 3 daily movements suggest resistance 18.5400-18.5500, and it has positive signs for much higher levels to be seen. However, we have not broken out of the range as yet.
From medium-term perspective (not long-term which suggest lower over time) we may see 18.8500 - 19.00 area based on MACD and Fisher form.
Strategy BUY @ 18.4150 - 18.4600 and take profit near 18.8050 first.
From medium-term perspective (not long-term which suggest lower over time) we may see 18.8500 - 19.00 area based on MACD and Fisher form.
Strategy BUY @ 18.4150 - 18.4600 and take profit near 18.8050 first.
Trade closed: target reached
The chart indicated a move higher, but entry point likely not reached. Disclaimer
The information and publications are not meant to be, and do not constitute, financial, investment, trading, or other types of advice or recommendations supplied or endorsed by TradingView. Read more in the Terms of Use.
Disclaimer
The information and publications are not meant to be, and do not constitute, financial, investment, trading, or other types of advice or recommendations supplied or endorsed by TradingView. Read more in the Terms of Use.