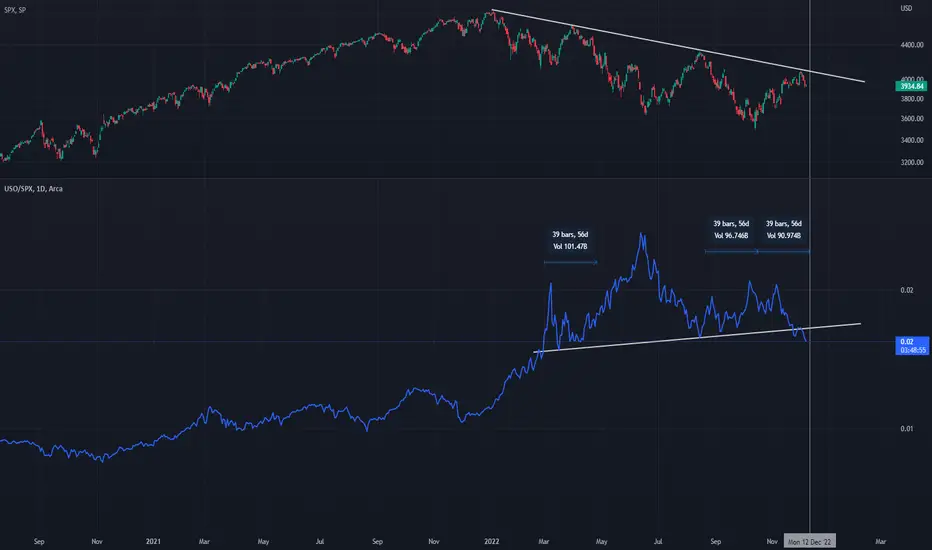
According to TA rules, the ratio has completed the pattern with a Complex Right Shoulder (two peaks).
Those these means that the SPX should breakout from that downward trendline? I don't know, but probably.
Or those it means that energy stocks should finally follow oil prices? Maybe, it is what normally had happend.
What I'm seeing is more stocks going up, even though some breakouts aren't working as smooth as it should.
Nontheless, I just follow price.
This ratio is just another indicator, let's wait and see what happens.
Those these means that the
Or those it means that energy stocks should finally follow oil prices? Maybe, it is what normally had happend.
What I'm seeing is more stocks going up, even though some breakouts aren't working as smooth as it should.
Nontheless, I just follow price.
This ratio is just another indicator, let's wait and see what happens.
Note
The patter has been broken, looks like oil will continue outperforming the S&P 500Related publications
Disclaimer
The information and publications are not meant to be, and do not constitute, financial, investment, trading, or other types of advice or recommendations supplied or endorsed by TradingView. Read more in the Terms of Use.
Related publications
Disclaimer
The information and publications are not meant to be, and do not constitute, financial, investment, trading, or other types of advice or recommendations supplied or endorsed by TradingView. Read more in the Terms of Use.