No clue how I found this chart, however, with looming concerns on various market, political and world disaster fronts - commodities, specifically OIL has been a major topic.
I still have to do some research on what this fund actually represents, however, I know for a fact it is at a key price point technically.
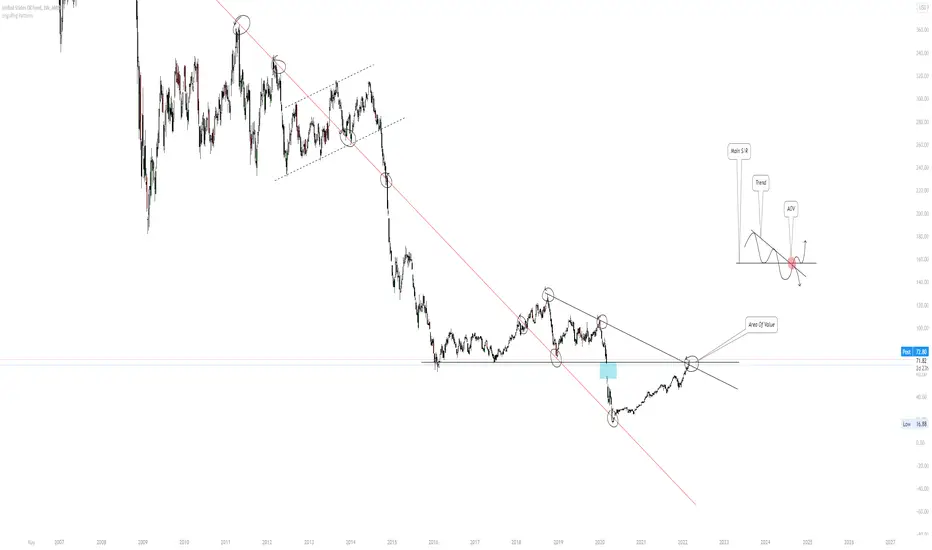
TECHNICALS
*At diagonal + horizontal resistance
*Fundamental factors could flip this level into support
*RED trendline is a long term TL that has served as a sort of mean reversion point since the beginning of this fund.
With price now on the right side of this line, this could be bullish when paired with everything else.
BELOW: Long term charts on the WEEKLY and MONTHLY timeframes.
Also something that should be noted - This security is also listed on FTX as a synthetic stock token.
Previous analyses related to OIL linked below.
I still have to do some research on what this fund actually represents, however, I know for a fact it is at a key price point technically.
TECHNICALS
- Widening downward cone
*At diagonal + horizontal resistance
*Fundamental factors could flip this level into support
*RED trendline is a long term TL that has served as a sort of mean reversion point since the beginning of this fund.
With price now on the right side of this line, this could be bullish when paired with everything else.
BELOW: Long term charts on the WEEKLY and MONTHLY timeframes.
Also something that should be noted - This security is also listed on FTX as a synthetic stock token.
Previous analyses related to OIL linked below.
Note
WEEKLYMONTHLY
Note
Trend break and no rejection. Likely for price to appreciate from here based on current price action.Once the prev. highs are broken this will be confirmed.
Note
bullishRelated publications
Disclaimer
The information and publications are not meant to be, and do not constitute, financial, investment, trading, or other types of advice or recommendations supplied or endorsed by TradingView. Read more in the Terms of Use.
Related publications
Disclaimer
The information and publications are not meant to be, and do not constitute, financial, investment, trading, or other types of advice or recommendations supplied or endorsed by TradingView. Read more in the Terms of Use.