Technical Analysis Overview:
1-Hour Chart:
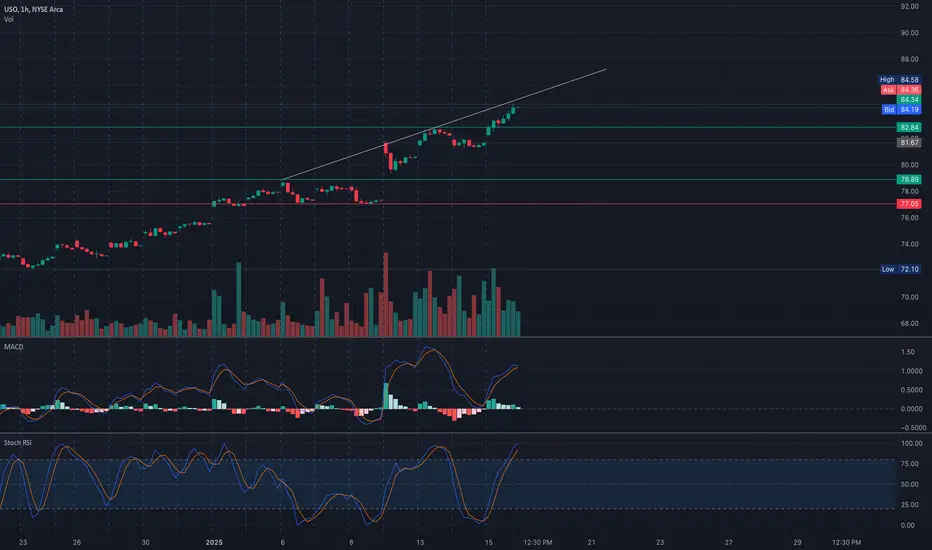
* Trend: USO is in a strong uptrend, reaching $84.36 near the upper trendline.
* Indicators:
* MACD: Positive momentum, with the MACD line above the signal line.
* Stochastic RSI: Overbought at 92.16, suggesting a potential pullback or consolidation.
30-Minute Chart:
* Price Action:
* USO is trading near resistance at $84.50, with support around $82.80.
* Increasing volume supports the recent bullish move.
Key Levels to Watch:
Support Levels:
* $82.80: Immediate support zone.
* $78.89: Strong support level.
* $77.05: Key support from prior consolidation.
Resistance Levels:
* $84.50: Immediate resistance at the upper trendline.
* $86: Next resistance level if $84.50 is breached.
Trade Scenarios:
Bullish Scenario:
* Entry: Break above $84.50 with volume confirmation.
* Target: $86-$88.
* Stop-Loss: Below $82.80 to limit risk.
Bearish Scenario:
* Entry: Rejection at $84.50 or breakdown below $82.80.
* Target: $80-$78.89.
* Stop-Loss: Above $84.50 to minimize losses.
Directional Bias:
* USO’s upward momentum suggests bullish strength, but the overbought Stochastic RSI warns of potential consolidation or a pullback near $84.50 resistance.
Conclusion:
USO is trading near critical resistance at $84.50. A breakout could propel prices toward $86, while failure to hold current levels may lead to a retest of support at $82.80 or lower. Monitor volume and momentum indicators for actionable setups.
Disclaimer: This analysis is for educational purposes only and does not constitute financial advice. Always conduct your research and trade responsibly.
1-Hour Chart:
* Trend: USO is in a strong uptrend, reaching $84.36 near the upper trendline.
* Indicators:
* MACD: Positive momentum, with the MACD line above the signal line.
* Stochastic RSI: Overbought at 92.16, suggesting a potential pullback or consolidation.
30-Minute Chart:
* Price Action:
* USO is trading near resistance at $84.50, with support around $82.80.
* Increasing volume supports the recent bullish move.
Key Levels to Watch:
Support Levels:
* $82.80: Immediate support zone.
* $78.89: Strong support level.
* $77.05: Key support from prior consolidation.
Resistance Levels:
* $84.50: Immediate resistance at the upper trendline.
* $86: Next resistance level if $84.50 is breached.
Trade Scenarios:
Bullish Scenario:
* Entry: Break above $84.50 with volume confirmation.
* Target: $86-$88.
* Stop-Loss: Below $82.80 to limit risk.
Bearish Scenario:
* Entry: Rejection at $84.50 or breakdown below $82.80.
* Target: $80-$78.89.
* Stop-Loss: Above $84.50 to minimize losses.
Directional Bias:
* USO’s upward momentum suggests bullish strength, but the overbought Stochastic RSI warns of potential consolidation or a pullback near $84.50 resistance.
Conclusion:
USO is trading near critical resistance at $84.50. A breakout could propel prices toward $86, while failure to hold current levels may lead to a retest of support at $82.80 or lower. Monitor volume and momentum indicators for actionable setups.
Disclaimer: This analysis is for educational purposes only and does not constitute financial advice. Always conduct your research and trade responsibly.
Disclaimer
The information and publications are not meant to be, and do not constitute, financial, investment, trading, or other types of advice or recommendations supplied or endorsed by TradingView. Read more in the Terms of Use.
Disclaimer
The information and publications are not meant to be, and do not constitute, financial, investment, trading, or other types of advice or recommendations supplied or endorsed by TradingView. Read more in the Terms of Use.