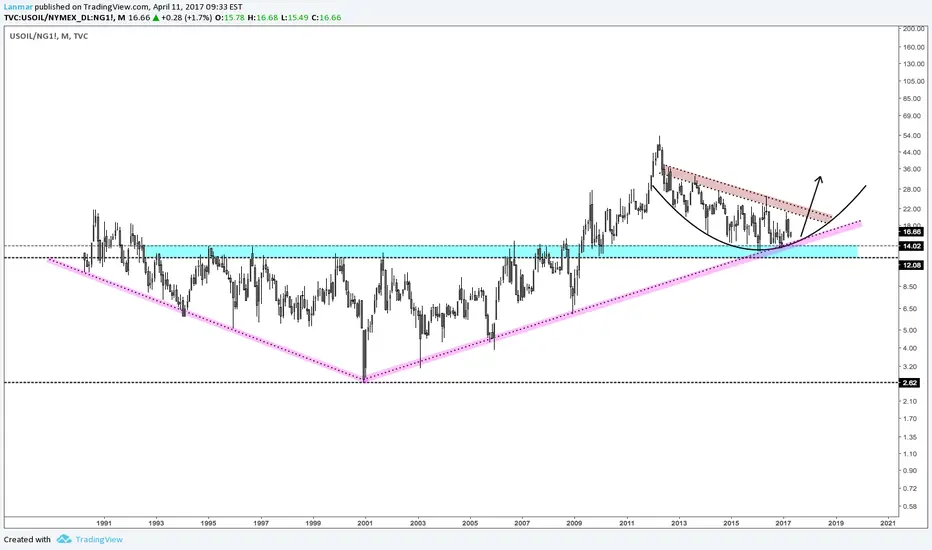
There is a cup and handle developing on the MONTHLY. The blue rectangle is the support in which the cup cannot break to remain valid. This ratio could, of course, break down, but statistically, it will likely rise in value over time.
How could this ratio go as high as the 30s or 40s? Or even higher?
A) Oil would have to go into the 100s while nat gas remains in the 3s.
B) Nat gas goes lower into the single digits while oil rises marginally, maybe high 60s.
B seems most probable to me.
The monthly on natural gas continues to look very weak:
Note
We have just broken out on a monthly basis in oil against nat gas. The options this spread gives us are three:Long oil, short nat gas
When long energy, avoid nat gas or overweight oil
when shorting energy, overweight nat gas
Disclaimer
The information and publications are not meant to be, and do not constitute, financial, investment, trading, or other types of advice or recommendations supplied or endorsed by TradingView. Read more in the Terms of Use.
Disclaimer
The information and publications are not meant to be, and do not constitute, financial, investment, trading, or other types of advice or recommendations supplied or endorsed by TradingView. Read more in the Terms of Use.