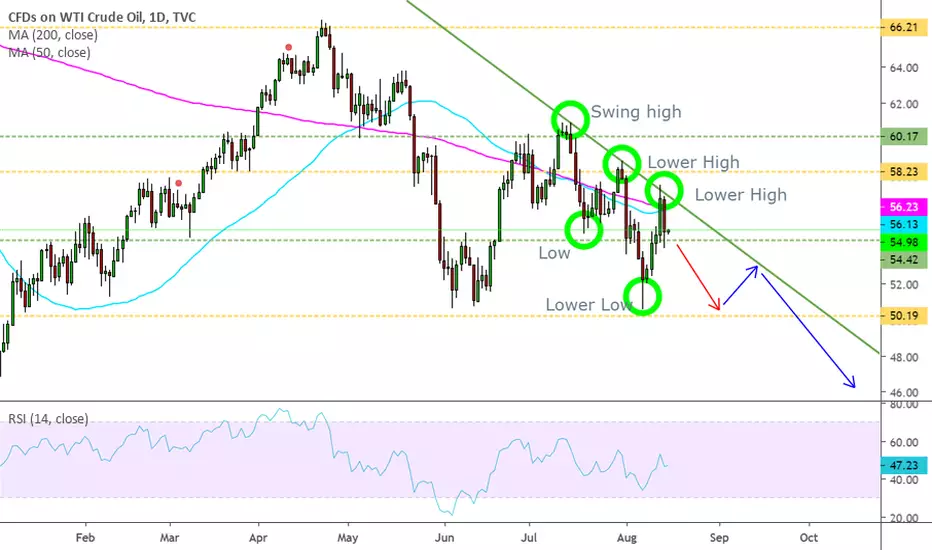
WTI has been making a series of lower highs and lower lows (green circles) respecting perfectly a trendline (green line). Unfortunately I didnt really see any entry yesterday. I expect the price to continue lower to at least the next support area at 50.2 (red arrow) and possibly continue bearish in the near future (blue arrow).
Let's look at the 4H chart and see how I am expecting to play this :

I am looking for the price to breath a little bit, ideally just above 55.30 and then look for any bearish signal to short it -> candlestick patterns, break of minor support on 1H, etc.
If we get no relieve move I will also be looking to short when the price breaks that major area of support at 54.4.
Trade safe!
Let's look at the 4H chart and see how I am expecting to play this :
I am looking for the price to breath a little bit, ideally just above 55.30 and then look for any bearish signal to short it -> candlestick patterns, break of minor support on 1H, etc.
If we get no relieve move I will also be looking to short when the price breaks that major area of support at 54.4.
Trade safe!
Trade active
It just hit 55.3 and reversed. Trade active, now fingers crossed for it to melt downDisclaimer
The information and publications are not meant to be, and do not constitute, financial, investment, trading, or other types of advice or recommendations supplied or endorsed by TradingView. Read more in the Terms of Use.
Disclaimer
The information and publications are not meant to be, and do not constitute, financial, investment, trading, or other types of advice or recommendations supplied or endorsed by TradingView. Read more in the Terms of Use.