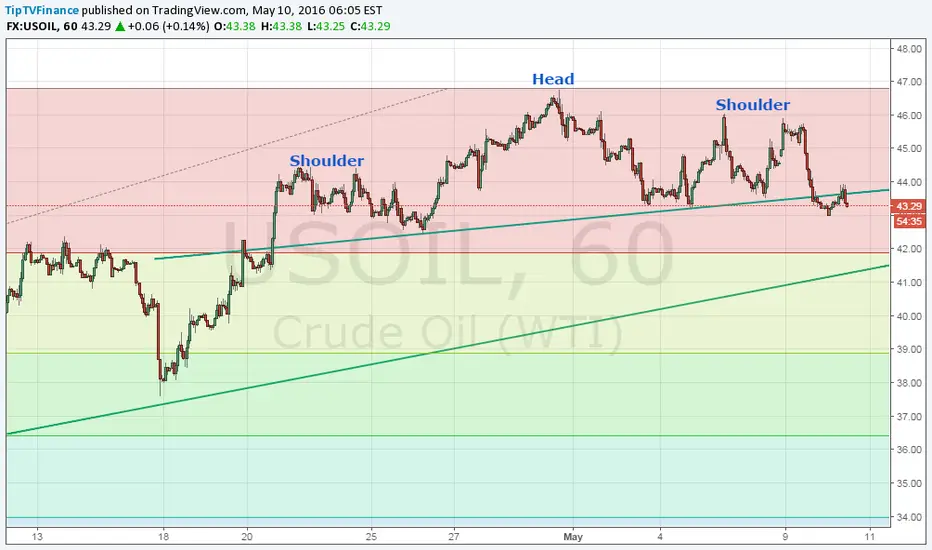
We have a head and shoulder breakout on the hourly chart, similar to the one seen on Brent hourly chart.
Hourly chart has confirmed a break below neckline level of $43.66. Failure to sustain above neckline followed by a drop below $43 levels could trigger a drop to confluence of support at $41.89 mentioned here.
On the other hand, a day end closing above $44.49 is needed for a re-test of $46.78 (Apr 29 high).
Related publications
Disclaimer
The information and publications are not meant to be, and do not constitute, financial, investment, trading, or other types of advice or recommendations supplied or endorsed by TradingView. Read more in the Terms of Use.
Related publications
Disclaimer
The information and publications are not meant to be, and do not constitute, financial, investment, trading, or other types of advice or recommendations supplied or endorsed by TradingView. Read more in the Terms of Use.