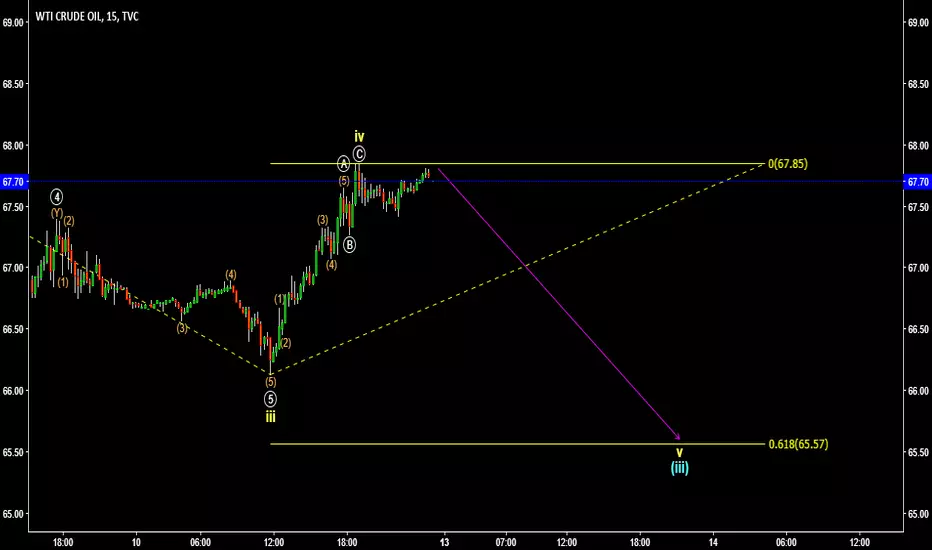
A bearish alternative to this idea > 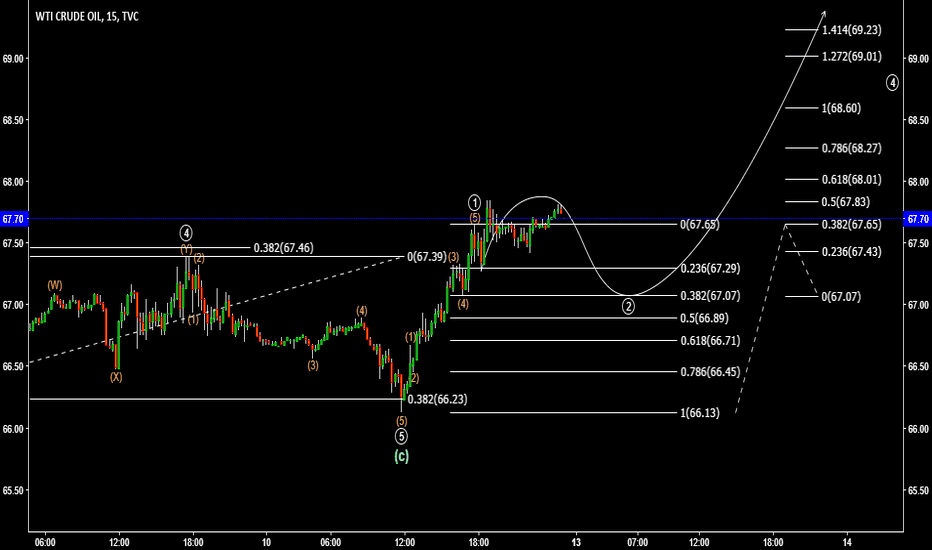
And smaller timeframe analysis to this theory >
I think it's possible that Fridays movement was an ABC to complete a larger degree wave 4. If you look on the 5m chart here > You can see 5 waves up (orange) before a pull back to the .236 level then up for one more wave which could be C; from the top there appears to be a starting wedge for what could be wave 1 down.
The key level for this theory to play out is Fridays high, above that level then the move is invalid (wave 2 crossing wave 1 starting point).
And smaller timeframe analysis to this theory >
I think it's possible that Fridays movement was an ABC to complete a larger degree wave 4. If you look on the 5m chart here >
The key level for this theory to play out is Fridays high, above that level then the move is invalid (wave 2 crossing wave 1 starting point).
Note
Invalid now a Fridays high broken.Note
THis turned out to be the right idea, I miscounted the ABC before the new high Disclaimer
The information and publications are not meant to be, and do not constitute, financial, investment, trading, or other types of advice or recommendations supplied or endorsed by TradingView. Read more in the Terms of Use.
Disclaimer
The information and publications are not meant to be, and do not constitute, financial, investment, trading, or other types of advice or recommendations supplied or endorsed by TradingView. Read more in the Terms of Use.