🚩 Classic Bear Flag on Oil 🛢
A textbook bear flag has formed on the oil chart:
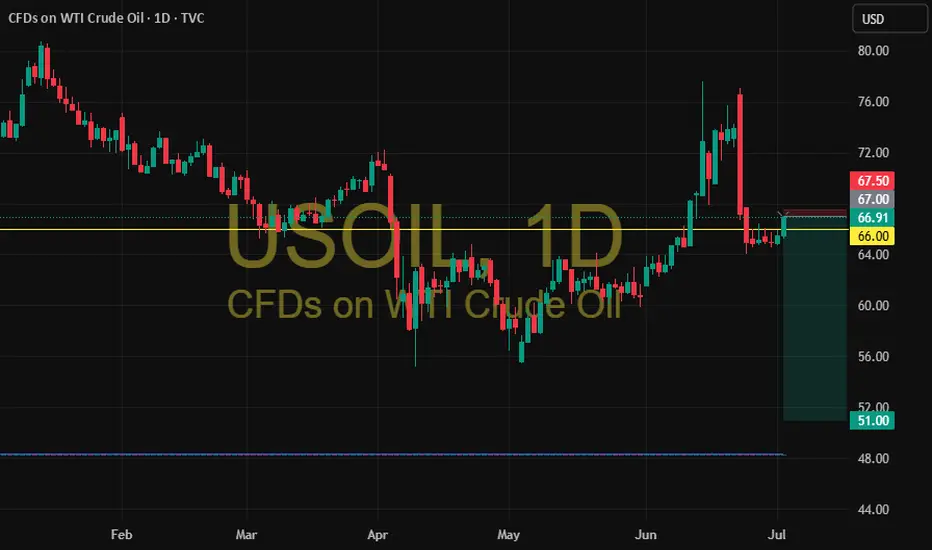
📏 Flagpole: From $77 down to $64 – a move of 13 points
📉 If price breaks below the lower support of the flag:
🎯 Target = $64 − $13 = $51
⚠️ This sets a bearish target at $51,
assuming momentum continues and there's no invalidation.
usoil 67
sl 67.5
tp1 66
tp2 65.5
tp3 65
tp4 64.5
tp5 open
A textbook bear flag has formed on the oil chart:
📏 Flagpole: From $77 down to $64 – a move of 13 points
📉 If price breaks below the lower support of the flag:
🎯 Target = $64 − $13 = $51
⚠️ This sets a bearish target at $51,
assuming momentum continues and there's no invalidation.
usoil 67
sl 67.5
tp1 66
tp2 65.5
tp3 65
tp4 64.5
tp5 open
Disclaimer
The information and publications are not meant to be, and do not constitute, financial, investment, trading, or other types of advice or recommendations supplied or endorsed by TradingView. Read more in the Terms of Use.
Disclaimer
The information and publications are not meant to be, and do not constitute, financial, investment, trading, or other types of advice or recommendations supplied or endorsed by TradingView. Read more in the Terms of Use.