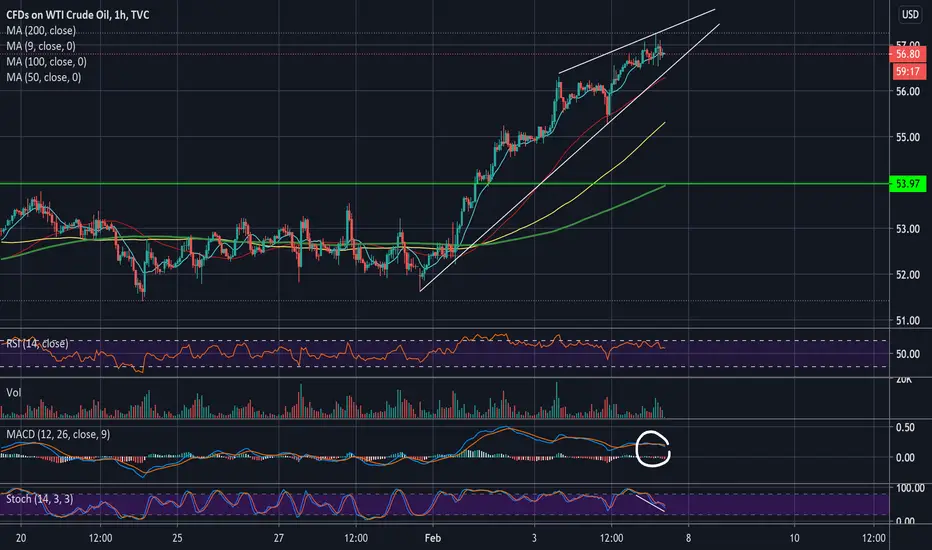
Here we can see a nice hourly divergence on US Oil 1 hr charts. Higher prices, bearish indictors so price should move a little lower.
Trading inside a rising wedge as well, a reversal pattern, major support at the green line. Look for the wedge to break to take profits after the break.
We can also see price is in optimum short zone as well above the falling daily trend line and at the top of another rising wedge

Stop loss at $57.30. Not everything works, but most things I post do. Here is another low risk high reward set up you might like to take.
Follow me on trading view for regular updates to this trade.
Trading inside a rising wedge as well, a reversal pattern, major support at the green line. Look for the wedge to break to take profits after the break.
We can also see price is in optimum short zone as well above the falling daily trend line and at the top of another rising wedge
Stop loss at $57.30. Not everything works, but most things I post do. Here is another low risk high reward set up you might like to take.
Follow me on trading view for regular updates to this trade.
Note
Further potential support lines ( take profit ) points shown should the wedge downside breakout failTrade closed manually
I'm out of this short with an uptick of the MACDH with a very small loss way before my stop was hit. I don't like staying in trades if they don't work fast or a contra signal comes. 5 min moving averages have remained way too bullish. I can always re-enter later if bearishness returnsDisclaimer
The information and publications are not meant to be, and do not constitute, financial, investment, trading, or other types of advice or recommendations supplied or endorsed by TradingView. Read more in the Terms of Use.
Disclaimer
The information and publications are not meant to be, and do not constitute, financial, investment, trading, or other types of advice or recommendations supplied or endorsed by TradingView. Read more in the Terms of Use.