hello guys.
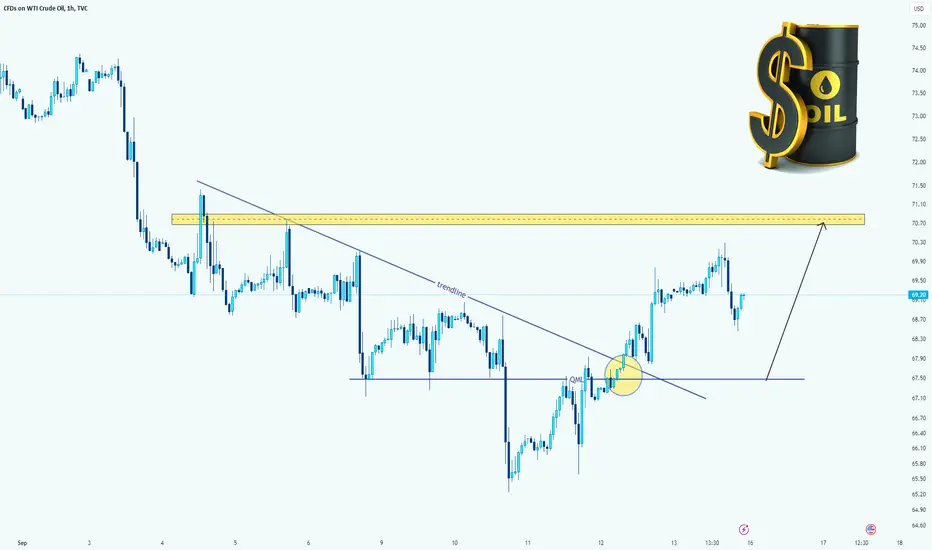
Trendline Break: The price has broken through a downward-sloping trendline, which is a potential signal for a trend reversal or continuation of the upward move.
Order Block Area: There is a highlighted horizontal zone (yellow) around the 70.30 level, which may act as a significant resistance or supply area. Traders are likely watching for a test or break of this zone.
QML Pattern (Quasimodo): The yellow circle highlights a QML pattern where the price reverses from a prior support level, suggesting a potentially bullish setup.
Upward Target: The projected arrow suggests that if the price can sustain above the broken trendline, it may attempt to reach the 70.30 resistance level, representing a potential price target.
Volume Consideration: While not displayed, monitoring volume increases as the price moves toward the target zone could validate the strength of the upward move.
Support Zone: A key support area appears around the 67.50 level, as shown by the horizontal blue line. If the price reverses, it could test this level again.
Overall, a bullish setup appears in place with key resistance around 70.30, but any failure to break that zone could result in a pullback to support around 67.50.
___________________________
✓✓✓ Always do your research.
❒❒❒ If you have any questions, you can write them in the comments below, and I will answer them.
❤︎ ❤︎ ❤︎And please don't forget to support this idea with your likes and comment
Note
it reacted to the yellow area very well!Trade closed: target reached
target touched:#oil #wti #usoil
Telegram channel: t.me/melikatrader94
Forex telegram channel: t.me/melikatrader94GoldForex
Forex telegram channel: t.me/melikatrader94GoldForex
Related publications
Disclaimer
The information and publications are not meant to be, and do not constitute, financial, investment, trading, or other types of advice or recommendations supplied or endorsed by TradingView. Read more in the Terms of Use.