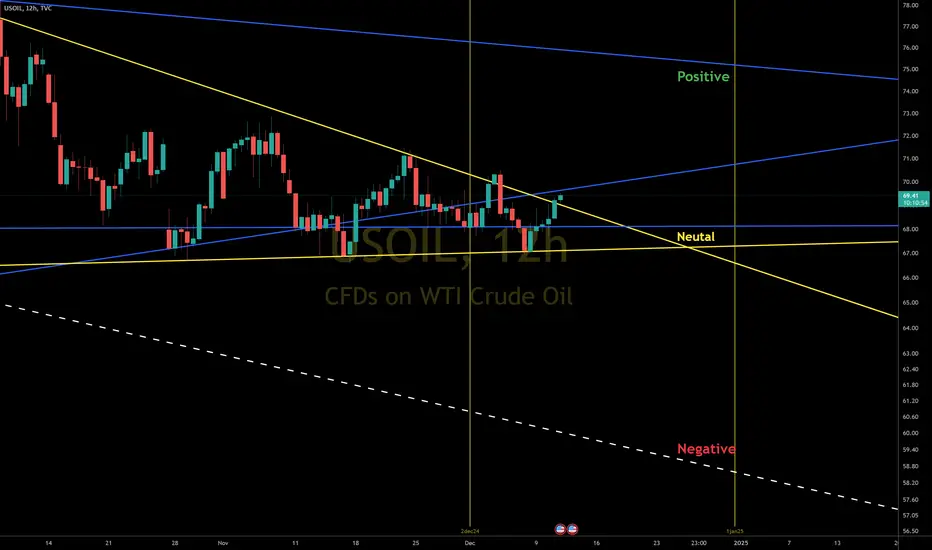
Crude oil is stuck between two structural monthly resistance lines (blue). On the daily chart, there’s a descending broadening wedge with a 50/50 breakout ratio — not very helpful as a leading indicator. A breakout could surprise the market and have a massive impact, as one of the CTKS Masterclass rules emphasizes: consolidation fuels explosions 💥
Scenarios:
🟢 Positive: Break above $72-$73 → strong bullish momentum
🟡 Neutral: Price stays between $67-$72 → consolidation
🔴 Negative: Break below $67 → potential drop toward $60
Given current conditions, I expect a neutral scenario with potential for a bullish breakout in January. Where do you think oil will end this month?
#CTKSmethod #Oil #Trading #MarketAnalysis
“Fake it until you make it! Act as if you had all the confidence you require until it becomes your reality.” – Brian Tracy
Disclaimer
The information and publications are not meant to be, and do not constitute, financial, investment, trading, or other types of advice or recommendations supplied or endorsed by TradingView. Read more in the Terms of Use.