🛢️ Crude Oil (WTI) Technical Analysis – Bearish Harmonic Pattern Completion
Pattern Overview:
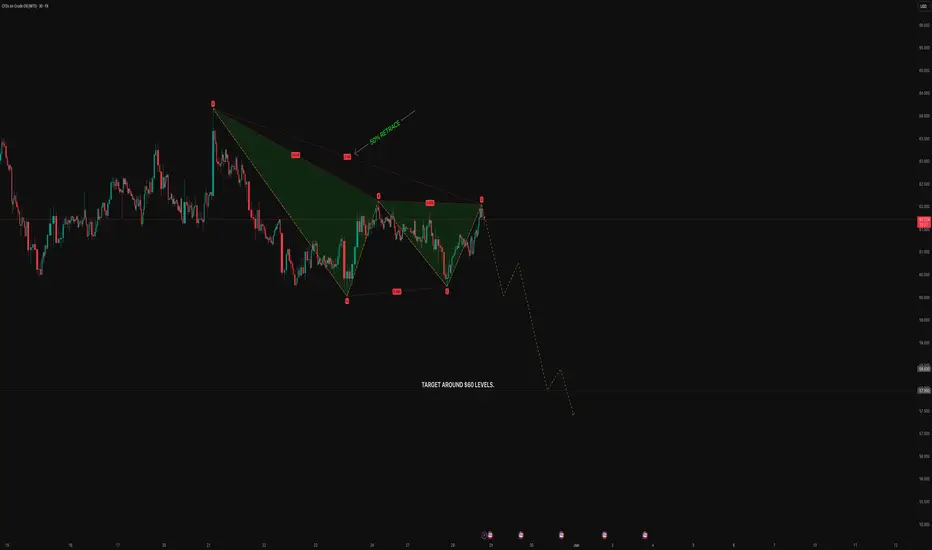
A Bearish Harmonic Pattern has been identified and completed.
The final leg (point D) has touched the 50% Fibonacci retracement of the previous XA leg, which validates the pattern's structure.
Key Observations:
Price has reversed from the D point, suggesting potential downside continuation.
Confirmation is observed with minor rejection wicks at the D zone.
The harmonic pattern indicates trend exhaustion and a reversal probability.
Price Action:
The current market level is near $61.75.
Price is expected to follow the projected zig-zag bearish path towards the target zone around $60, with further possible extension down to $58.90.
Technical Conclusion:
✅ Harmonic pattern completed
🔻 Bearish sentiment initiated post-pattern
🎯 Target zone: $60–$58.90
Trading Insight:
If price sustains below point D with weak bullish response, shorts will get initiated with tight stop-loss above D-point highs. Strong follow-through could bring a quick drop towards the projected support levels.
⚠️ Disclaimer:
This analysis is for educational and informational purposes only. It does not constitute financial advice or a trading recommendation. Please conduct your own research or consult with a financial advisor before making any trading decisions.
Pattern Overview:
A Bearish Harmonic Pattern has been identified and completed.
The final leg (point D) has touched the 50% Fibonacci retracement of the previous XA leg, which validates the pattern's structure.
Key Observations:
Price has reversed from the D point, suggesting potential downside continuation.
Confirmation is observed with minor rejection wicks at the D zone.
The harmonic pattern indicates trend exhaustion and a reversal probability.
Price Action:
The current market level is near $61.75.
Price is expected to follow the projected zig-zag bearish path towards the target zone around $60, with further possible extension down to $58.90.
Technical Conclusion:
✅ Harmonic pattern completed
🔻 Bearish sentiment initiated post-pattern
🎯 Target zone: $60–$58.90
Trading Insight:
If price sustains below point D with weak bullish response, shorts will get initiated with tight stop-loss above D-point highs. Strong follow-through could bring a quick drop towards the projected support levels.
⚠️ Disclaimer:
This analysis is for educational and informational purposes only. It does not constitute financial advice or a trading recommendation. Please conduct your own research or consult with a financial advisor before making any trading decisions.
Disclaimer
The information and publications are not meant to be, and do not constitute, financial, investment, trading, or other types of advice or recommendations supplied or endorsed by TradingView. Read more in the Terms of Use.
Disclaimer
The information and publications are not meant to be, and do not constitute, financial, investment, trading, or other types of advice or recommendations supplied or endorsed by TradingView. Read more in the Terms of Use.