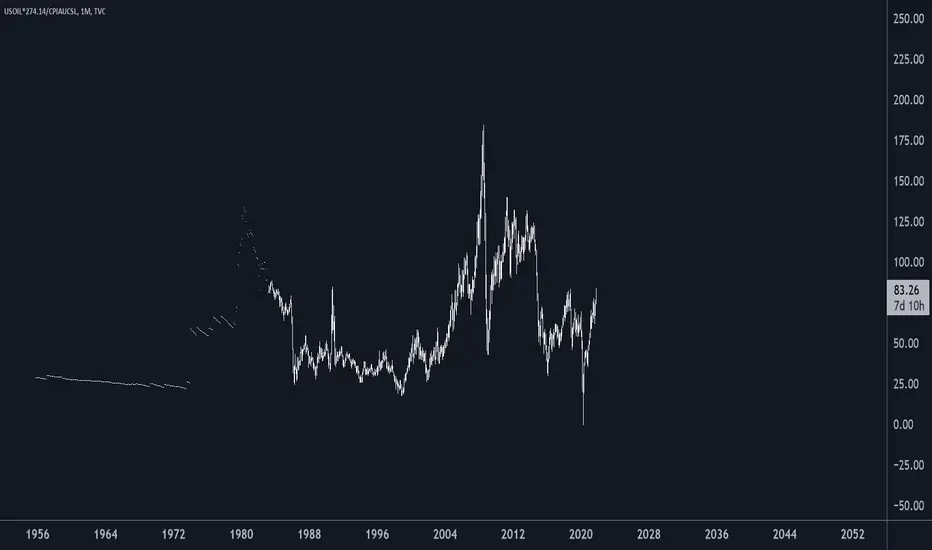
This chart is adjusted for inflation. That means it is only valid for the current value of US consumer CPI, in other words just this month. Next month it will probably have to be re-calculated.
It shows that the demand of the current fuel crisis pales in comparison to demand in the wake of the 2007 financial crisis. What if we are still at the early stages in this demand cycle? Oil at $200 (in nominal price) would bring the world to a complete stop, unless of course inflation has made $200 relatively insignificant a price.
Video on how inflation was adjusted for in this chart: https://tradingview.sweetlogin.com/chart/BLX/l3ridmWS-Adjust-for-Inflation-Real-Price-vs-Nominal-Price/
Note
OIL update. Corrected for inflation. This will be crazy. Not trading advice tra la la.Note
UPDATE: top inflation adjusted, bottom nominal price Note
WOWOWOW xDyeah
Note
UPDATE: wow it does seem that the real resistance is given by inflation
Related publications
Disclaimer
The information and publications are not meant to be, and do not constitute, financial, investment, trading, or other types of advice or recommendations supplied or endorsed by TradingView. Read more in the Terms of Use.
Related publications
Disclaimer
The information and publications are not meant to be, and do not constitute, financial, investment, trading, or other types of advice or recommendations supplied or endorsed by TradingView. Read more in the Terms of Use.