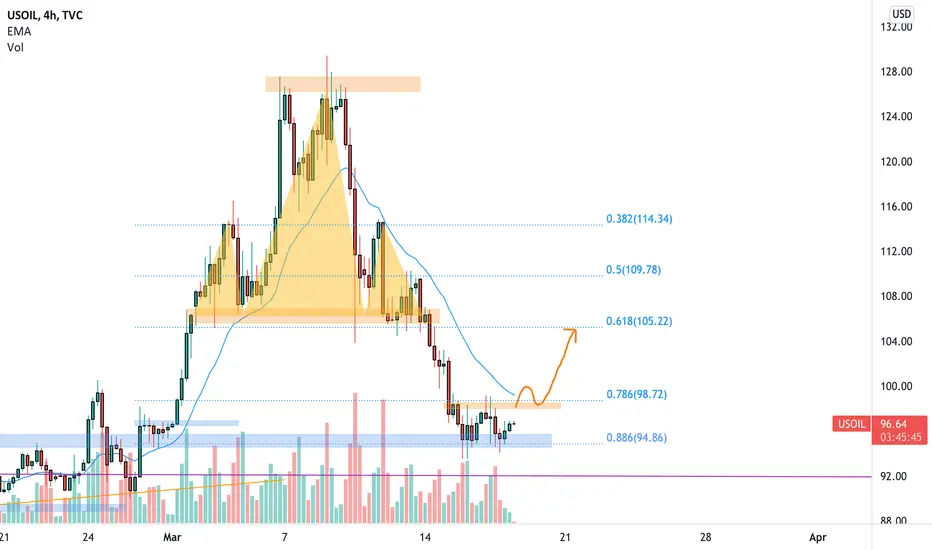
USOIL after the recent highs dropped at the 0.886 Fibonacci level.
The price after the break of the H&S neckline moved to the support and ranging between the lower level and the 0.786 resistance.
How can we approach this scenario?
We will check for a possible break of the 98 resistance level and in that case i will check if the Plancton's strategy rules will be satisfied to set a nice long order.
-––
Follow the Shrimp 🦐
Keep in mind.
🟣 Purple structure -> Monthly structure.
🔴 Red structure -> Weekly structure.
🔵 Blue structure -> Daily structure.
🟡 Yellow structure -> 4h structure.
⚫️ Black structure -> <4h structure.
Here is the Plancton0618 technical analysis , please comment below if you have any question.
The ENTRY in the market will be taken only if the condition of the Plancton0618 strategy will trigger.
Note
The market is moving upward as expected, currently broke above the resistance structure
Note
Note
Note
Note
Note
Note
Disclaimer
The information and publications are not meant to be, and do not constitute, financial, investment, trading, or other types of advice or recommendations supplied or endorsed by TradingView. Read more in the Terms of Use.
Disclaimer
The information and publications are not meant to be, and do not constitute, financial, investment, trading, or other types of advice or recommendations supplied or endorsed by TradingView. Read more in the Terms of Use.