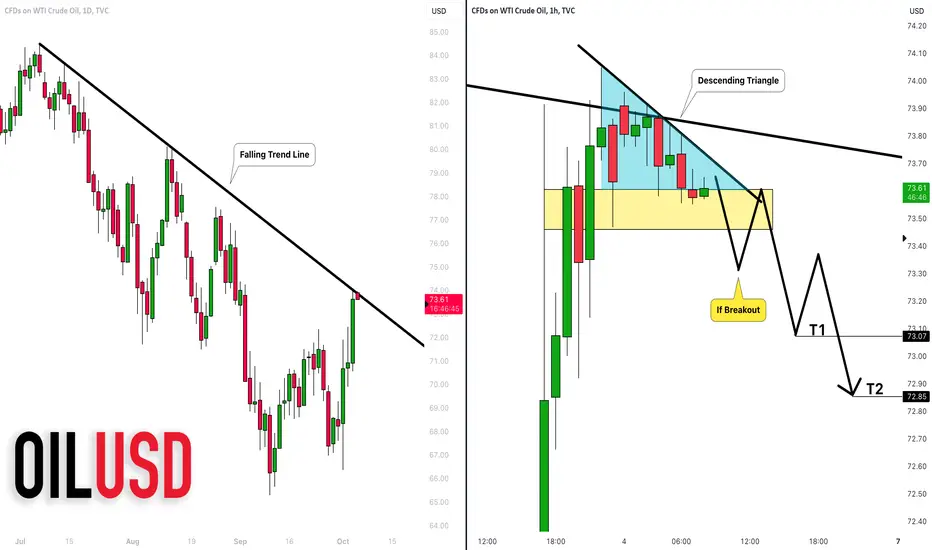
WTI Crude Oil is testing a significant falling trend line on a daily.
To short that with a confirmation, pay attention to a descending triangle
pattern on an hourly time frame.
Your signal will be a breakout of its horizontal neckline
- an hourly candle close below 73.46.
Short the market aggressively or on a retest, then.
Targets: 73.07 / 72.85
Alternatively, a bullish violation of a trend line will be a strong bullish signal.
❤️Please, support my work with like, thank you!❤️
✅Join My Telegram Channel: t.me/VasilyTrading
❗️YouTube Channel youtube.com/c/VasilyTrader
✅ Facebook: facebook.com/VasilyTrading/
⭐ My Forex & Gold Broker: bit.ly/vasilyforexbroker ⭐
❗️YouTube Channel youtube.com/c/VasilyTrader
✅ Facebook: facebook.com/VasilyTrading/
⭐ My Forex & Gold Broker: bit.ly/vasilyforexbroker ⭐
Related publications
Disclaimer
The information and publications are not meant to be, and do not constitute, financial, investment, trading, or other types of advice or recommendations supplied or endorsed by TradingView. Read more in the Terms of Use.