Oil opened the week under pressure after OPEC+ confirmed a 547,000 bpd increase for September, completing a 2.5 million bpd reversal of past cuts—about 2.4% of global demand. The group is now undecided—future moves could be more hikes, a pause, or even cuts, depending on market conditions. Actual supply growth may be closer to 1.7 million bpd due to member constraints, while expectations are that this could be the last hike amid slowing demand and rising non-OPEC output. With oil demand softening, a Q4 surplus looming, and prices under $70, holding steady seems likely for now. Meanwhile, geopolitical pressure from Trump over Russian oil adds more uncertainty, where a final call by OPEC may come at the next meeting on September 7.
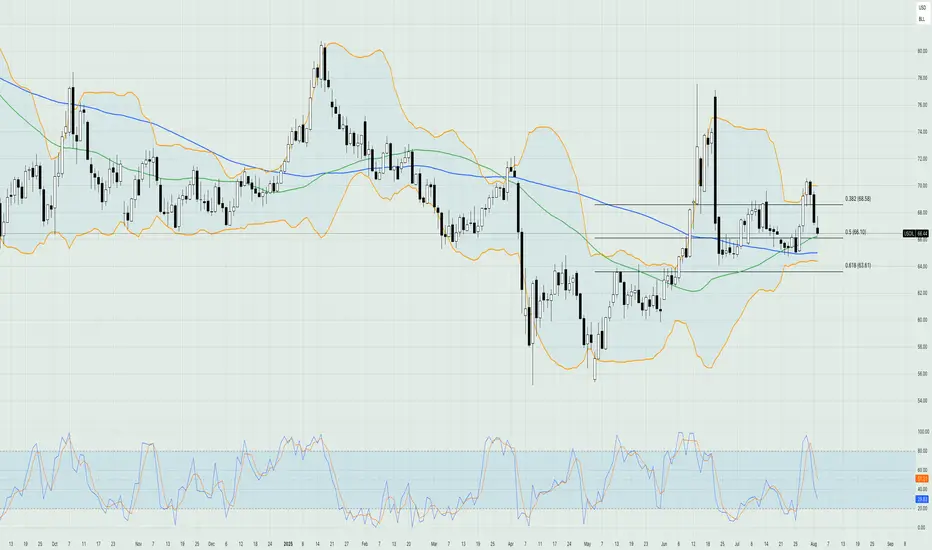
On the technical side, the price of crude oil is currently testing the support of the 50% weekly Fibonacci retracement level while the moving averages are still validating a bullish trend in the market. The Bollinger bands are expanding, showing that volatility is picking up in the market for crude oil, while the Stochastic oscillator is approaching extreme oversold levels, hinting that a bullish correction might be on the horizon in the upcoming sessions. If this scenario becomes reality, then the first area of potential resistance might be seen around the $70 level, which consists of the psychological resistance of the round number, the upper band of the Bollinger bands, and the previous medium-term high since late July.
Disclaimer: The opinions in this article are personal to the writer and do not reflect those of Exness
Disclaimer
The information and publications are not meant to be, and do not constitute, financial, investment, trading, or other types of advice or recommendations supplied or endorsed by TradingView. Read more in the Terms of Use.
Disclaimer
The information and publications are not meant to be, and do not constitute, financial, investment, trading, or other types of advice or recommendations supplied or endorsed by TradingView. Read more in the Terms of Use.