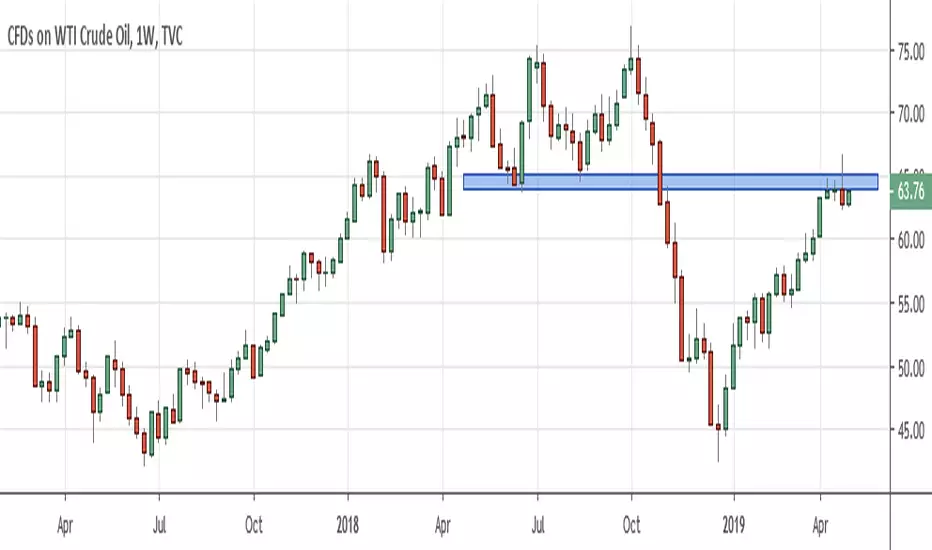
Last week's bearish candle that printed on WTI has caught my eye.
Firstly, the move higher early on in the week would have caught a lot of bullish trend traders off-guard.
If you switch to the daily timeframe, the picture is even bleaker for the bulls - that pin-bar on weekly looks like a good old fashioned blow off top on the daily.
So where to from here?
For me, I need to see price trading below $62 to initiate a short. If price just eats up last weeks range, drifting higher, that would make me do a full 180 and expect more upside.
Trade closed: target reached
Disclaimer
The information and publications are not meant to be, and do not constitute, financial, investment, trading, or other types of advice or recommendations supplied or endorsed by TradingView. Read more in the Terms of Use.
Disclaimer
The information and publications are not meant to be, and do not constitute, financial, investment, trading, or other types of advice or recommendations supplied or endorsed by TradingView. Read more in the Terms of Use.