Look at possible structure for wave 5 as per this chart > 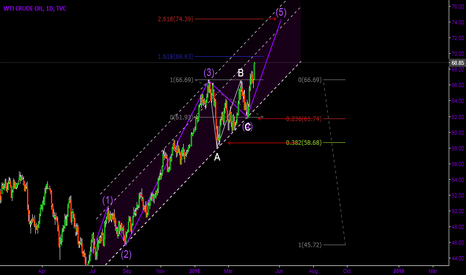
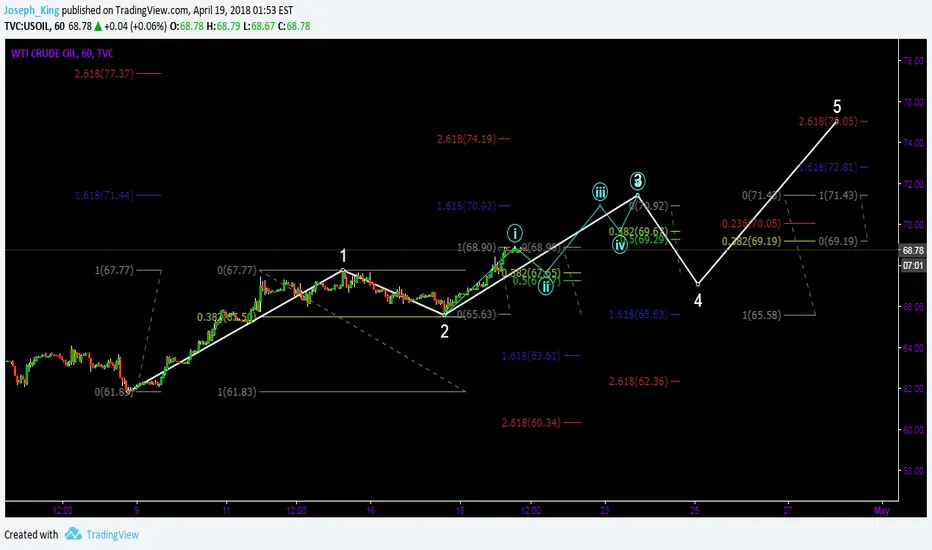
Could have completed wave 1 from 6183 to 6775, then 0.382 correction (a fairly common wave 2 fib level), now in sub wave 1 of 3, with sub wave 2 on the way.
There does appear to be a pennant/triangle forming though which could mean a little more upside to 6910-6950 >
Could have completed wave 1 from 6183 to 6775, then 0.382 correction (a fairly common wave 2 fib level), now in sub wave 1 of 3, with sub wave 2 on the way.
There does appear to be a pennant/triangle forming though which could mean a little more upside to 6910-6950 >
Note
Wave 4 (white waves) in the chart should be at 6919, not where it's currently showing.Disclaimer
The information and publications are not meant to be, and do not constitute, financial, investment, trading, or other types of advice or recommendations supplied or endorsed by TradingView. Read more in the Terms of Use.
Disclaimer
The information and publications are not meant to be, and do not constitute, financial, investment, trading, or other types of advice or recommendations supplied or endorsed by TradingView. Read more in the Terms of Use.