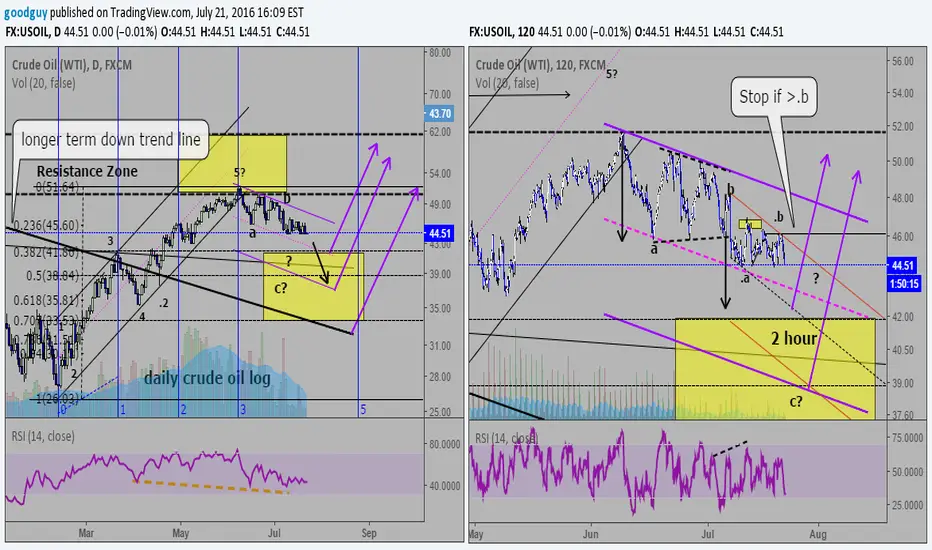
Good down day for crud oil. I am lowering my stop from "b" to ".b" (46.07). I've drawn a secondary channel on the 2 hour chart. . I would not be surprised to get some bounce up around 41.85 to 42.50
Longer term I still there is a good chance the correction may go to 50% or even 70.7% (to kiss goodbuy to the long term down trend line although that would seems like a crude thing to do).
I put a "fib fan" on the daily chart just for the fun of it. I was surprised to see the lines match up so well with the recent highs. Does that suggest the correction may be over at the next line around August 25th?. I don't have a clue. Do any of you have any experience with this tool. Would like some help?
Disclaimer
The information and publications are not meant to be, and do not constitute, financial, investment, trading, or other types of advice or recommendations supplied or endorsed by TradingView. Read more in the Terms of Use.
Disclaimer
The information and publications are not meant to be, and do not constitute, financial, investment, trading, or other types of advice or recommendations supplied or endorsed by TradingView. Read more in the Terms of Use.