https://tradingview.sweetlogin.com/x/4UJP881P/
💡Message Strategy
The daily chart of WTI crude oil shows a 30% increase from late May to mid-June, with prices stagnating below resistance near $76. The Commodity Channel Index (CCI) has been overbought since late May and is now approaching a potential buy signal below 100.
Volatility peaked on June 14 and has since fallen back, suggesting that oil prices could see a correction if tensions in the Middle East do not escalate further. But now that the United States is out of the game and the situation could escalate at any time, crude oil is still in a bullish market.
📊Technical aspects
From the daily chart level, crude oil prices have broken through the upper resistance of the range in the medium term and tested a new high of 75.00. The moving average system is in a bullish arrangement, and the medium-term objective trend is upward. The current trend is in the upward rhythm of the main trend. The MACD indicator fast and slow lines overlap with the bullish column above the zero axis, indicating that the bullish momentum is currently full, and it is expected that the medium-term trend is expected to usher in a wave of rising rhythm.
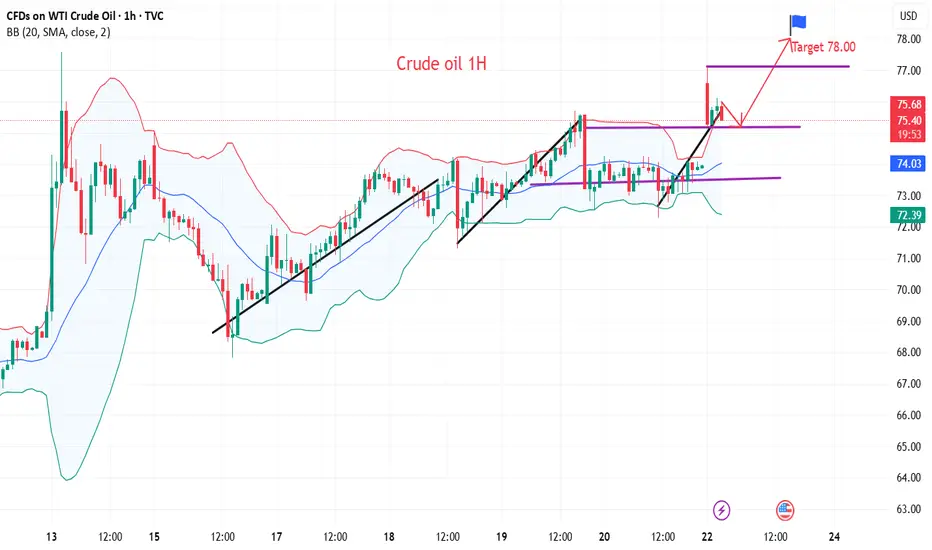
The short-term (1H) trend of crude oil fluctuated and then broke through upward, and the oil price tested a new high near 78.40. The moving average system gradually opened upward, and the short-term objective trend direction was upward.
In terms of momentum, the MACD indicator fast and slow lines opened upward near the zero axis, and the bullish momentum was dominant. It is expected that the trend of crude oil will maintain a high level of fluctuation upward.
💰Strategy Package
Long Position:74.50-75.50,SL:73.50
Short-term target is around 77.00-78.00
💡Message Strategy
The daily chart of WTI crude oil shows a 30% increase from late May to mid-June, with prices stagnating below resistance near $76. The Commodity Channel Index (CCI) has been overbought since late May and is now approaching a potential buy signal below 100.
Volatility peaked on June 14 and has since fallen back, suggesting that oil prices could see a correction if tensions in the Middle East do not escalate further. But now that the United States is out of the game and the situation could escalate at any time, crude oil is still in a bullish market.
📊Technical aspects
From the daily chart level, crude oil prices have broken through the upper resistance of the range in the medium term and tested a new high of 75.00. The moving average system is in a bullish arrangement, and the medium-term objective trend is upward. The current trend is in the upward rhythm of the main trend. The MACD indicator fast and slow lines overlap with the bullish column above the zero axis, indicating that the bullish momentum is currently full, and it is expected that the medium-term trend is expected to usher in a wave of rising rhythm.
The short-term (1H) trend of crude oil fluctuated and then broke through upward, and the oil price tested a new high near 78.40. The moving average system gradually opened upward, and the short-term objective trend direction was upward.
In terms of momentum, the MACD indicator fast and slow lines opened upward near the zero axis, and the bullish momentum was dominant. It is expected that the trend of crude oil will maintain a high level of fluctuation upward.
💰Strategy Package
Long Position:74.50-75.50,SL:73.50
Short-term target is around 77.00-78.00
Through scientific and rigorous financial analysis and personalized strategy formulation, we help you achieve stable growth of wealth. At the same time, in a complex and changing economic environment, we help you avoid potential risks and protect the saf
Related publications
Disclaimer
The information and publications are not meant to be, and do not constitute, financial, investment, trading, or other types of advice or recommendations supplied or endorsed by TradingView. Read more in the Terms of Use.