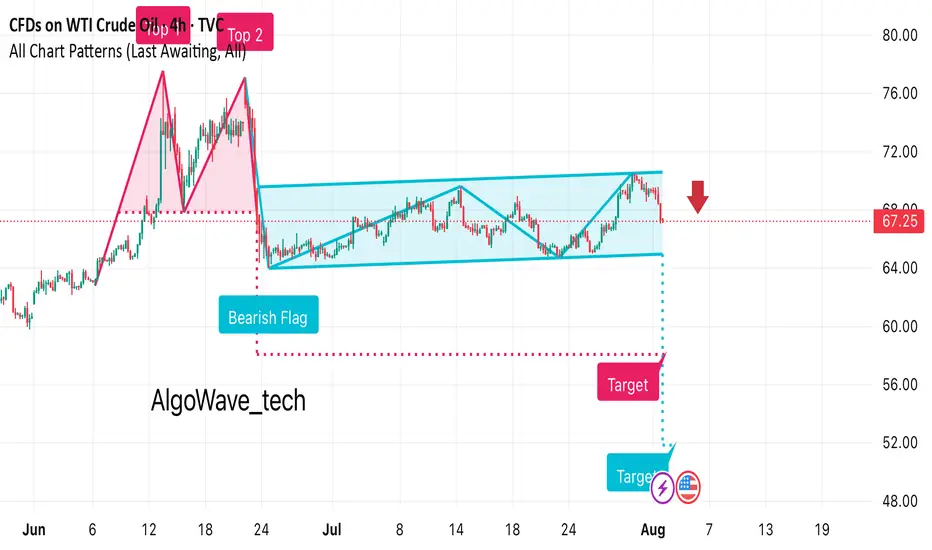
• Previous Move: There’s a strong downward leg before the flag formation, indicating bearish momentum.
• Flag Pattern: Price consolidates in an upward-sloping channel after the drop.
• Breakout: The chart suggests a bearish breakout below the channel, marked with a red arrow at around $67.25.
• Target Projection: The measured move target appears to be around the $53–54 range, based on the flagpole height.
𝙇𝙚𝙩'𝙨 𝙎𝙩𝙖𝙧𝙩 𝙔𝙤𝙪𝙧 𝙟𝙤𝙪𝙧𝙣𝙚𝙮 𝙒𝙞𝙩𝙝 𝙎𝙖𝙛𝙚 𝙏𝙧𝙖𝙙𝙞𝙣𝙜 𝙈𝙖𝙨𝙩𝙚𝙧 𝙡𝙚𝙫𝙚𝙡 𝙏𝙧𝙖𝙙𝙞𝙣g
Disclaimer
The information and publications are not meant to be, and do not constitute, financial, investment, trading, or other types of advice or recommendations supplied or endorsed by TradingView. Read more in the Terms of Use.
𝙇𝙚𝙩'𝙨 𝙎𝙩𝙖𝙧𝙩 𝙔𝙤𝙪𝙧 𝙟𝙤𝙪𝙧𝙣𝙚𝙮 𝙒𝙞𝙩𝙝 𝙎𝙖𝙛𝙚 𝙏𝙧𝙖𝙙𝙞𝙣𝙜 𝙈𝙖𝙨𝙩𝙚𝙧 𝙡𝙚𝙫𝙚𝙡 𝙏𝙧𝙖𝙙𝙞𝙣g
Disclaimer
The information and publications are not meant to be, and do not constitute, financial, investment, trading, or other types of advice or recommendations supplied or endorsed by TradingView. Read more in the Terms of Use.