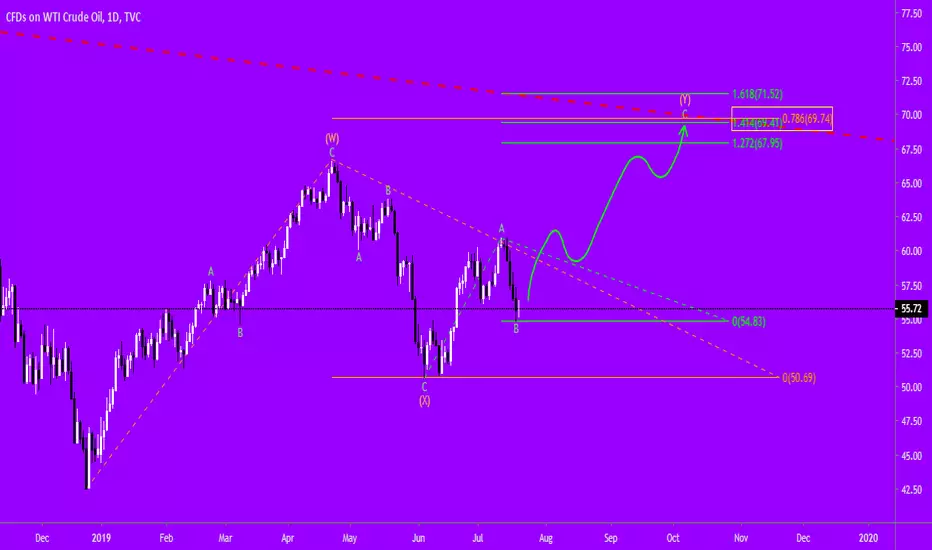
An update to this idea specifically:
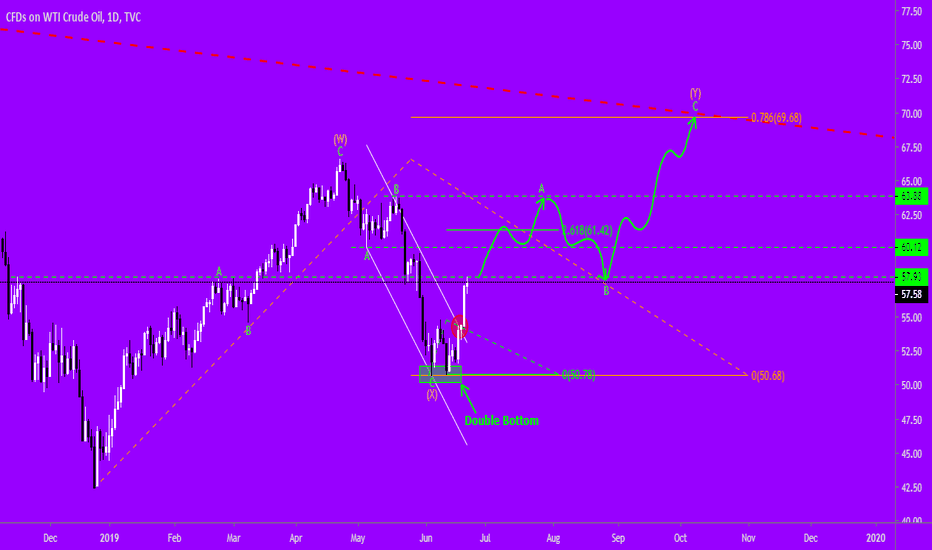
Thinking that A & B of of a larger Y wave are completed and C of Y could begin soon; the red dashed line on this chart is the monthly bearish trendline below:

All part of larger degree idea here that the bearish trendline is tested again near $70, back to $50, then breakout of the massive triangle towards $90 >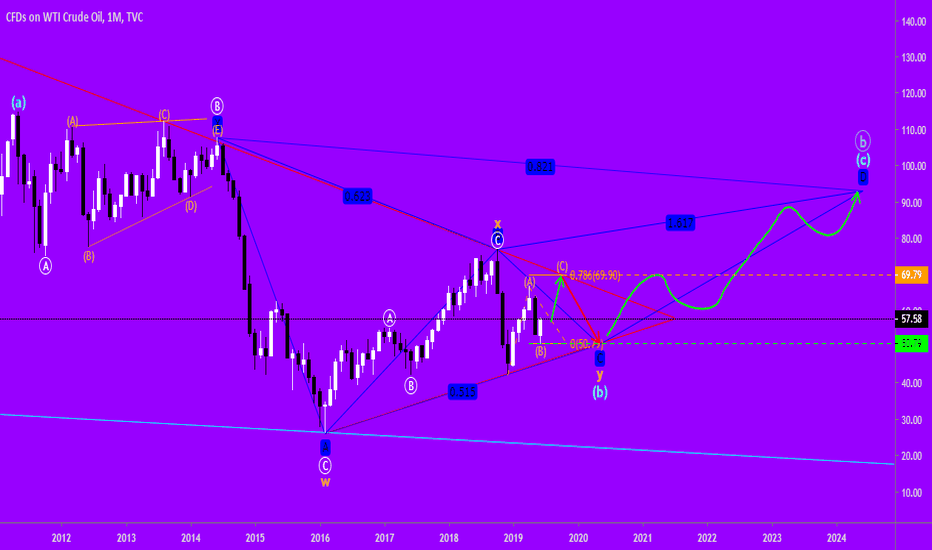
Thinking that A & B of of a larger Y wave are completed and C of Y could begin soon; the red dashed line on this chart is the monthly bearish trendline below:
All part of larger degree idea here that the bearish trendline is tested again near $70, back to $50, then breakout of the massive triangle towards $90 >
Disclaimer
The information and publications are not meant to be, and do not constitute, financial, investment, trading, or other types of advice or recommendations supplied or endorsed by TradingView. Read more in the Terms of Use.
Disclaimer
The information and publications are not meant to be, and do not constitute, financial, investment, trading, or other types of advice or recommendations supplied or endorsed by TradingView. Read more in the Terms of Use.