Hello guys! Let's dive into WTI!
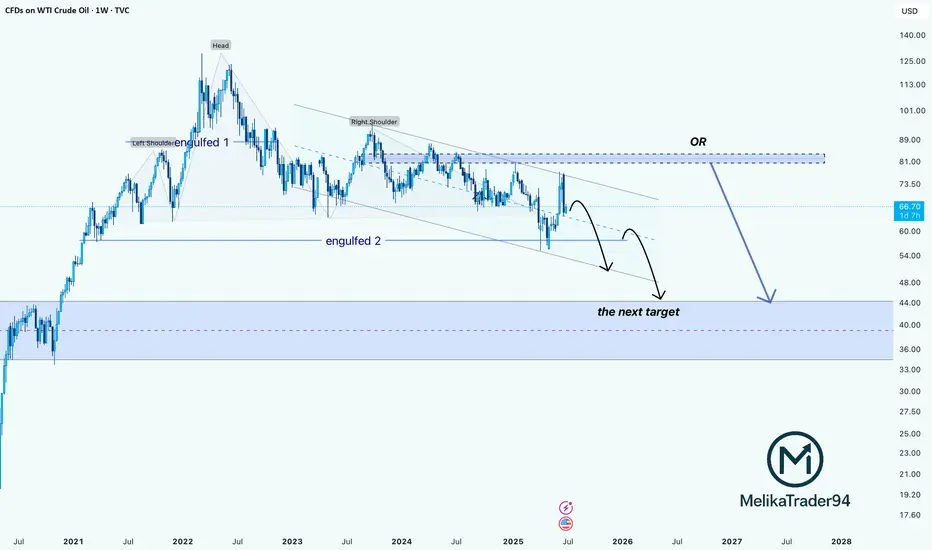
The weekly chart of WTI Crude Oil reveals a bearish Head & Shoulders pattern playing out over a long-term descending channel. Price recently got rejected from the upper trendline, showing weakness despite a short-term bounce.
- Engulfed 1 & 2:
Two major engulfing zones failed to hold as support, turning into strong resistance.
- Bearish Scenario in Play:
After the recent upside move into resistance, price is likely to follow one of two paths:
- Continuation Within the Channel:
Rejection from the upper bound of the descending channel leads to a stair-step decline toward the $47–52 zone.
- Final Rejection from Supply Zone ($83–89):
A larger corrective push could test this area before a full collapse toward the long-term demand zone.
____________________
Invalidation point:
Unless crude oil breaks above the $89 zone with strong volume, all signs point to further downside.
The chart structure favors a slow bleed with temporary bounces, ultimately targeting the $40s.
The weekly chart of WTI Crude Oil reveals a bearish Head & Shoulders pattern playing out over a long-term descending channel. Price recently got rejected from the upper trendline, showing weakness despite a short-term bounce.
- Engulfed 1 & 2:
Two major engulfing zones failed to hold as support, turning into strong resistance.
- Bearish Scenario in Play:
After the recent upside move into resistance, price is likely to follow one of two paths:
- Continuation Within the Channel:
Rejection from the upper bound of the descending channel leads to a stair-step decline toward the $47–52 zone.
- Final Rejection from Supply Zone ($83–89):
A larger corrective push could test this area before a full collapse toward the long-term demand zone.
- Main Target:
____________________
Invalidation point:
Unless crude oil breaks above the $89 zone with strong volume, all signs point to further downside.
The chart structure favors a slow bleed with temporary bounces, ultimately targeting the $40s.
Trade active
Telegram channel: t.me/melikatrader94
Forex telegram channel: t.me/melikatrader94GoldForex
Forex telegram channel: t.me/melikatrader94GoldForex
Related publications
Disclaimer
The information and publications are not meant to be, and do not constitute, financial, investment, trading, or other types of advice or recommendations supplied or endorsed by TradingView. Read more in the Terms of Use.