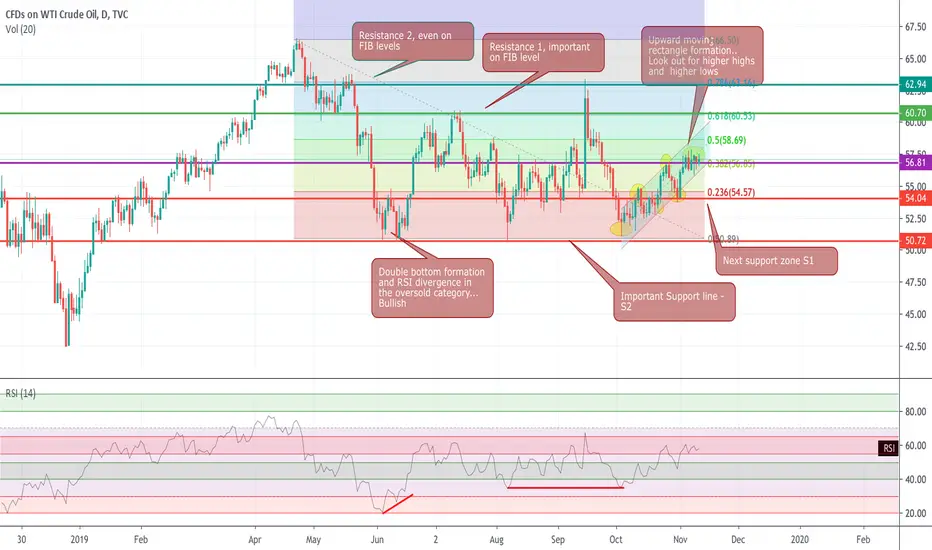
I have shown various timelines and important support and resistance levels going ahead.
Look for signs if price makes higher highs and higher lows, for confirmation of uptrend. and channel being respected.
So far price has respected the centre green zone as support levels on the RSI
The chart is self-explanatory .
If you like what you read then please share a thumbs up!
Cheers
Note
Price is now testing the lower channels of the trend lines drawn out. RSI has nicely settle in the center green zone indicating support if it turns upwards, price may then bounce and move upwards to test he upper channel. Watch out for false break outs.. One may want to look at divergences and confirmations for breakouts.Cheers
Note
Price moving well within the range so far, nicely towards the support line. If rejected, look out for retest upwards towards the upper trend line. Important to look where RSI goes from hereonNote
Oil breaks the trend line (false breakout) as it could not hold the test of 2 days confirmation. Price back in the trend line. In my experience when price does a false break out, most times It tries and test the opposite side of the channel. Look out for more actionIf you love what you see, pls share a thumbs up and a comment in the section below
Disclaimer
The information and publications are not meant to be, and do not constitute, financial, investment, trading, or other types of advice or recommendations supplied or endorsed by TradingView. Read more in the Terms of Use.
If you love what you see, pls share a thumbs up and a comment in the section below
Disclaimer
The information and publications are not meant to be, and do not constitute, financial, investment, trading, or other types of advice or recommendations supplied or endorsed by TradingView. Read more in the Terms of Use.